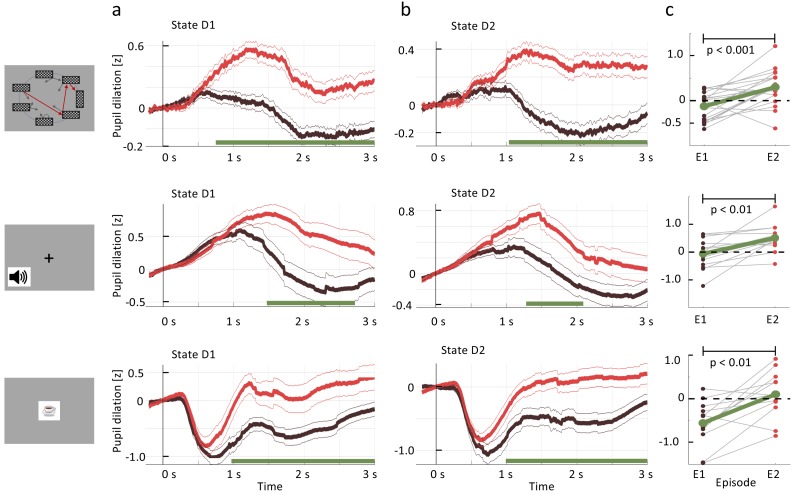
Figure 4. Pupil dilation reflects one-shot learning.
(a) Pupil responses to state D1 are larger during episode 2 (red curve) than during episode 1 (black). (b) Pupil responses to state D2 are larger during episode 2 (red curve) than during episode 1 (black). Top row: spatial, middle row: sound, bottom row: clip-art condition. Pupil diameter averaged across all participants in units of standard deviation (z-score, see Materials and methods), aligned at stimulus onset and plotted as a function of time since stimulus onset. Thin lines indicate the pupil signal ± SEM. Green lines indicate the time interval during which the two curves differ significantly (). Significance was reached at a time , which depends on the condition and the state: spatial D1: (22, 131, 85); spatial D2: (22, 137,130) sound D1: (15, 34, 19); sound D2: (15, 35, 33); clip-art D1: (12, 39, 19); clip-art D2: (12, 45, 41); (Numbers in brackets: number of participants, number of pupil traces in episode 1 or 2, respectively). (c) Participant-specific mean pupil dilation at state D2 (averaged over the interval (1000 ms, 2500 ms)) before (black dot) and after (red dot) the first reward. Grey lines connect values of the same participant. Differences between episodes are significant (paired t-test, p-values indicated in the Figure).

