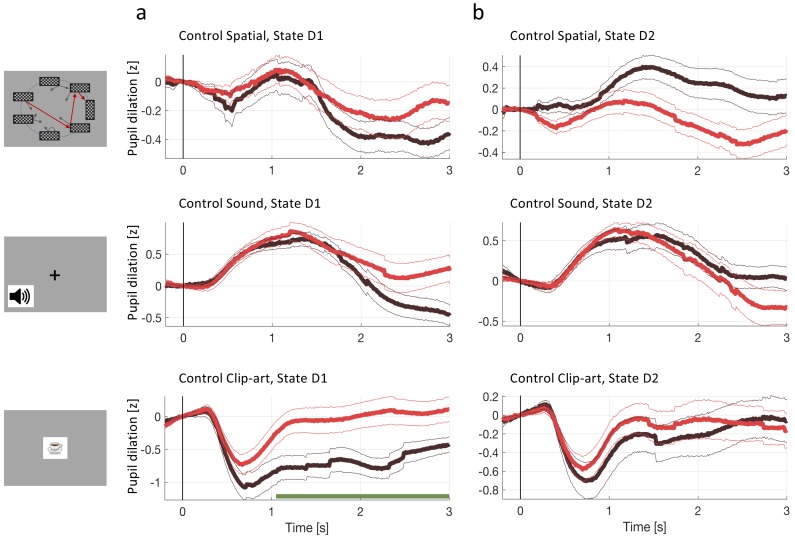
Figure 5. Pupil dilation during the second control experiment.
In the second control experiment, different participants passively observed state sequences which were recorded during the main experiment. Data analysis was the same as for the main experiment. (a) Pupil time course after state onset () of state D1 (before goal). (b) State D2 (two before goal). Black traces show the pupil dilation during episode one, red traces during episode two. At state D1 in the clip-art condition, the pupil time course shows a separation similar to the one observed in the main experiment. This suggest that participants may recognize the clip-art image that appears just before the final image. Importantly in state D2, the pupil time course during episode 2 is qualitatively different from the one in the main experiment (Figure 4).

