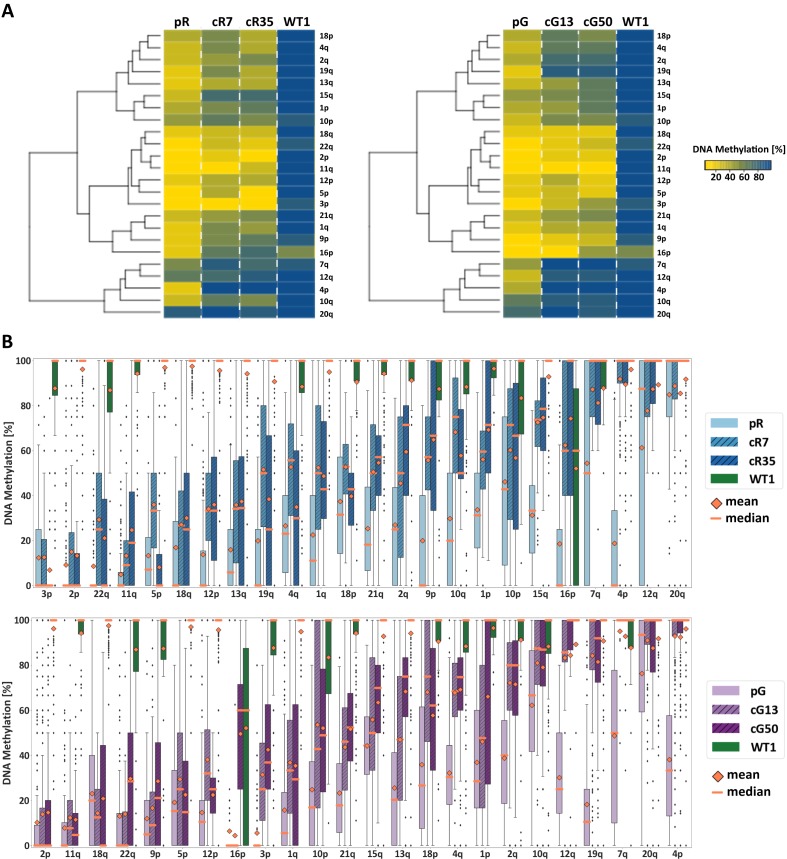
Figure 2. Subtelomeric methylation is differentially restored following DNMT3B correction.
(A) Subtelomeric methylation analysis by whole genome bisulfite sequencing (WGBS). DNA of ICF iPSCs pR and pG, their corrected clones cR7, cR35 and cG13, cG50 respectively, and WT iPSCs UN1-22 (WT1) was subjected to WGBS sequencing. DNA from corrected clones was analyzed 35 and 12 passages following correction of pR and pG iPSCs, respectively. The heatmaps display the mean methylation of all CpGs within the most distal 2 kb prior to the telomere tract of 24 subtelomeres. Hierarchical clustering of samples appears to the left of the heatmaps. (B) DNA methylation level distribution of the analyzed subtelomeres based on the degree of restored methylation following correction. Methylation level distribution is presented by boxplots for each of the 24 analyzed subtelomeres, with mean and median values indicated as orange diamonds and bars, respectively. Upper plot - pR and corrected clones, lower plot - pG and corrected clones. Subtelomeres are ranked from left to right based on averaging of the methylation level medians of both corrected clones.

