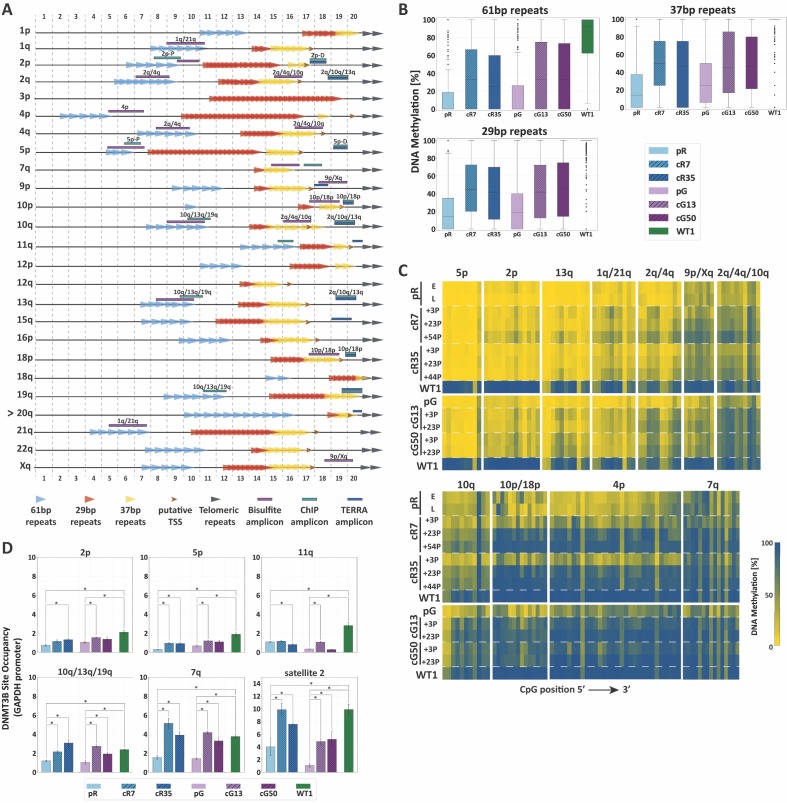
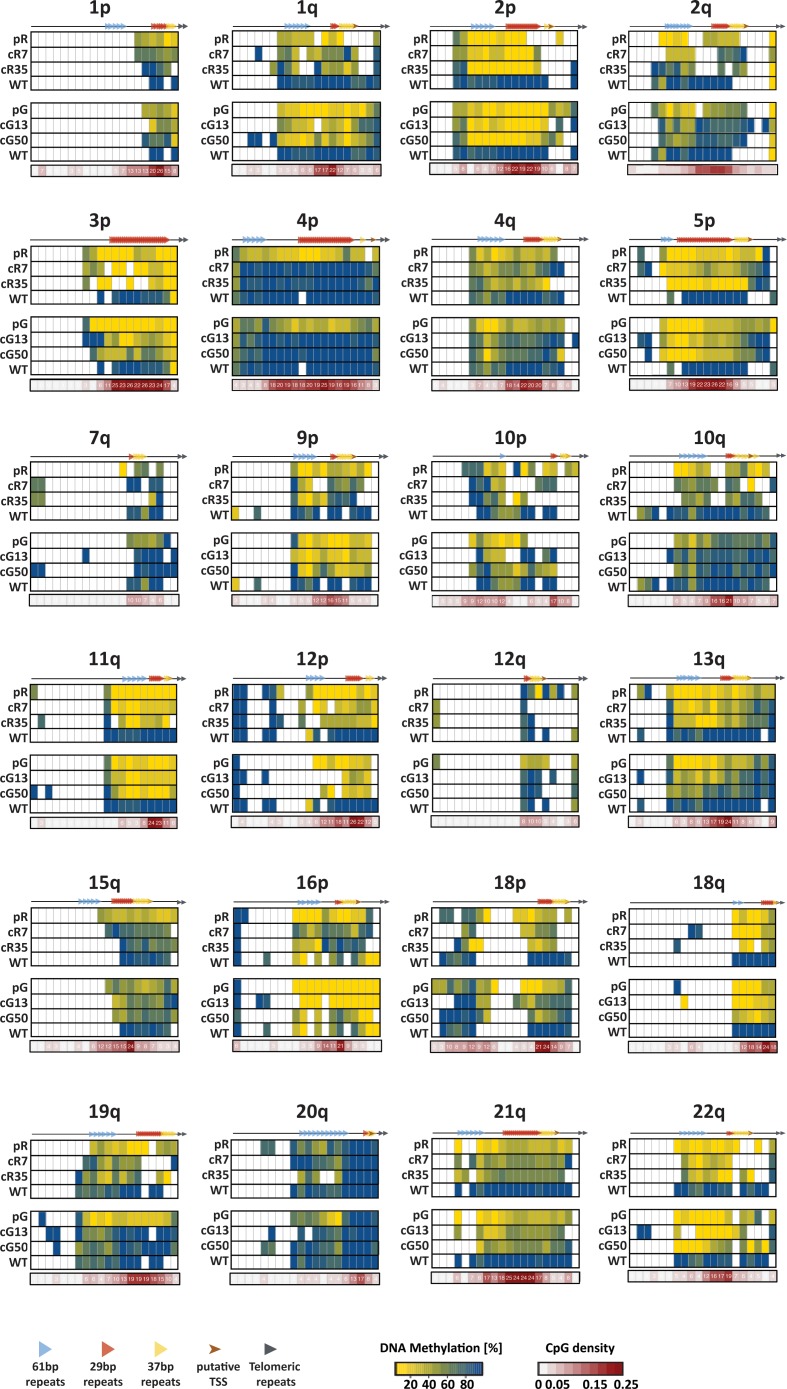
Figure 3. TERRA promoter repeats are variably resistant to de novo methylation following DNMT3B correction in correlation with DNMT3B enrichment.
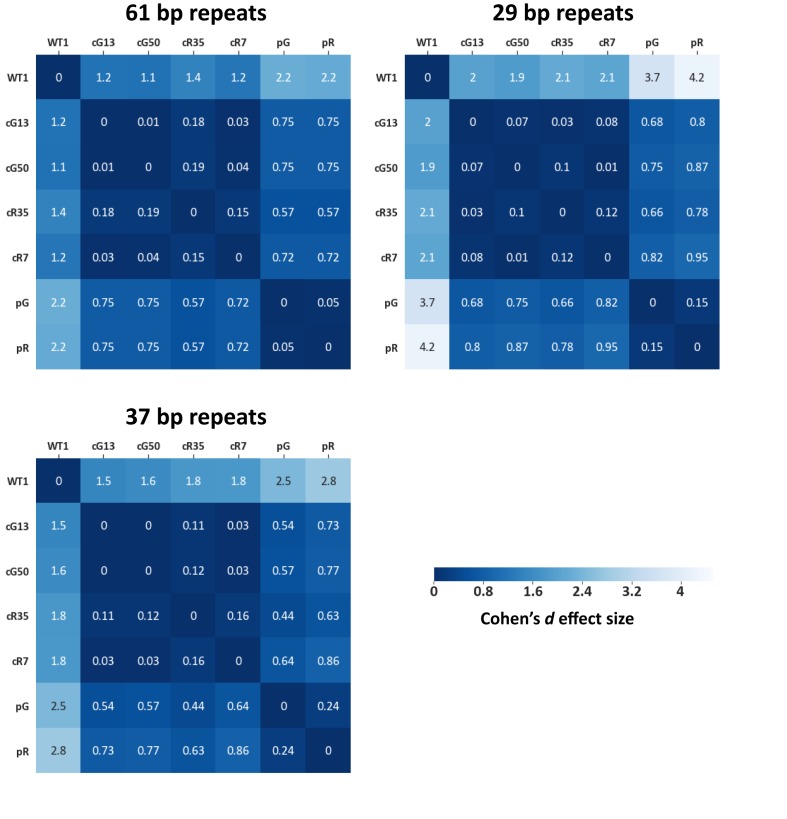
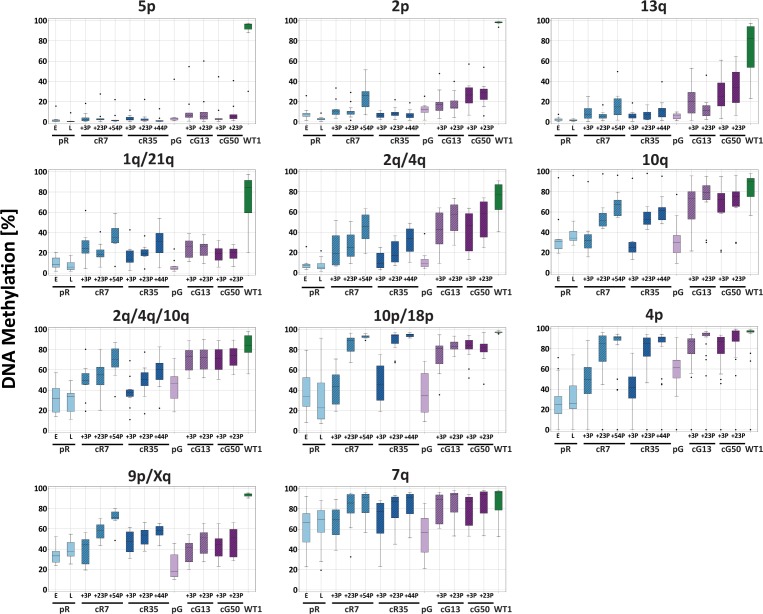
(A) TERRA promoter components along human subtelomeres. The positions of the 61-, 29- and 37 bp repeats comprising TERRA promoters are depicted along the distal 2 kb of a subset of human telomeres. Putative transcription start sites (TSS) are based on Diman et al. (2016). The distal ends of the subtelomeres are depicted by the gray arrows on the right. The arrow to the left of telomere 20q indicates that this telomere lacks a clear telomeric tract at its distal end. The regions amplified in the various analyses, are indicated on the maps. The 2 kb regions are divided into100 bps bins, marked at both top and bottom of the maps. TERRA promoter elements on additional subtelomeres appear in Figure 3—figure supplement 1. (B) Distribution of DNA methylation levels at the TERRA promoter repeats. The boxplots demonstrate the DNA methylation levels as determined by WGBS of the 61-, 29- and 37 bp repeats from many subtelomeres collectively, in ICF iPSCs pR and pG, their corrected clones cR7, cR35 and cG13, cG50 respectively, and WT iPSCs (WT1) (See also Figure 3—figure supplements 1 and 2 and Supplementary file 2. (C) DNA methylation at specific TERRA promoter regions following DNMT3B correction. Targeted bisulfite analysis of specific TERRA promoter regions from 14 subtelomeres in ICF iPSC, their corrected clones at two or three time points following isolation, and WT UN1-22 iPSCs (WT1). The passage (P) at which DNA was extracted for analysis appears to the left of the heatmaps. The plus (+) indicates the number of passages since the corrected clones were isolated. The heatmaps display the methylation percentage across the various amplicons. Each subtelomeric region consists of several columns, each representing a specific CpG site, in the 5′ to 3′ direction of the sequence (left to right). (See also Figure 3—figure supplement 3 and Supplementary file 1. (D) DNMT3B binding at various subtelomeres prior and post correction. Corrected clones were analyzed at passages 35–45 following isolation. Subtelomeres 2p and 5p were analyzed with the upstream 2p-P and 5p-P primer sets (Figure 3A, and Supplementary file 3. Two-tailed Mann-Whitney U-tests were performed to determine statistical differences between WT and ICF samples and between the original ICF iPSCs and their corrected clones (*=p value<0.05). Bars and error bars represent means and SEM of at least three experimental repeats.


