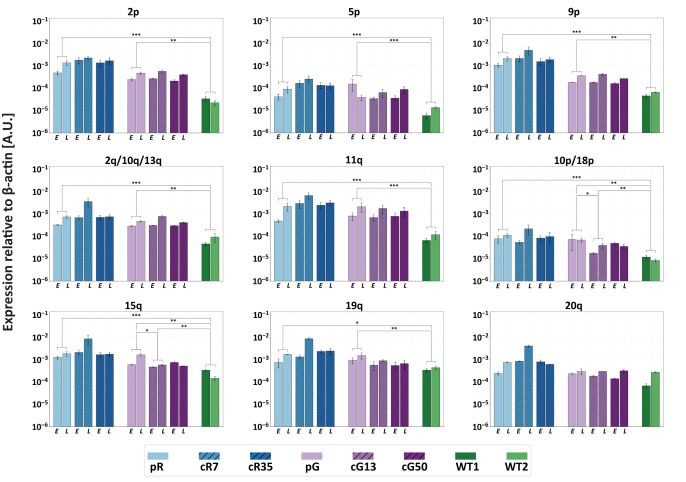
Figure 4. Restoration of DNMT3B activity is insufficient to repress TERRA expression.
TERRA expression from various telomeres depicted above the graphs, was determined for uncorrected ICF iPSCs, corrected clones and control WT iPSCs (UN1-22 and FSE-5m; WT1 and WT2, respectively), using primers described in Supplementary file 3. TERRA was determined for the ICF iPSCs at an early (E) and late (L) passage. The time points at which TERRA levels were determined: pR- passages 30 and 66, cR7 – 14 and 54 passages following isolation, cR35 –14 and 47 passages following isolation, pG- passages 27 and 44, cG13 – 10 and 30 passages following isolation, cG50 – 7 and 28 passages following isolation, WT1 – passage 48, WT2 – passage 64. Each bar represents the mean of the relative TERRA expression compared to expression of β-actin in the same sample. Error bars represent SEM of at least three experimental repeats. A one-tailed Mann-Whitney U-test was performed to determine statistical differences between WT and ICF samples and between the original ICF and its corrected clones (*=p value<0.05, **=p value<0.01, ***=p value<0.001).

