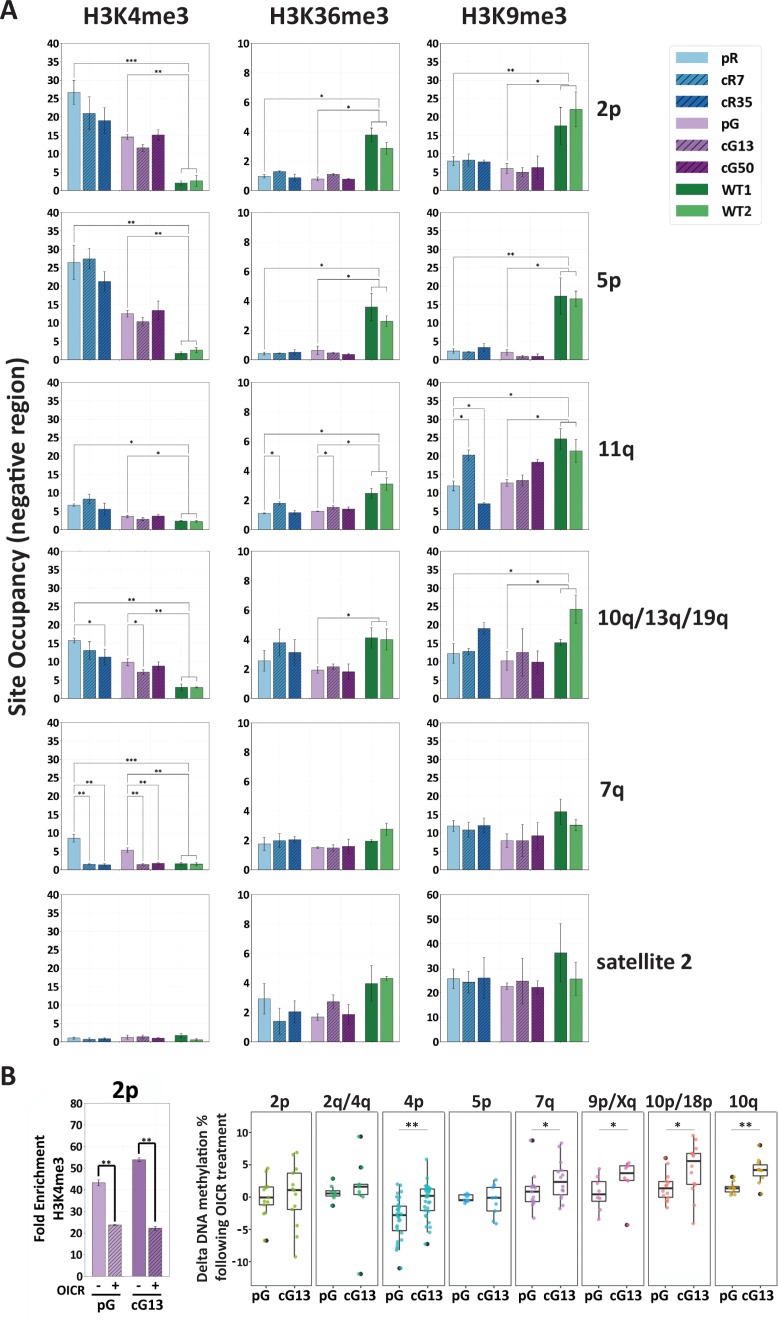
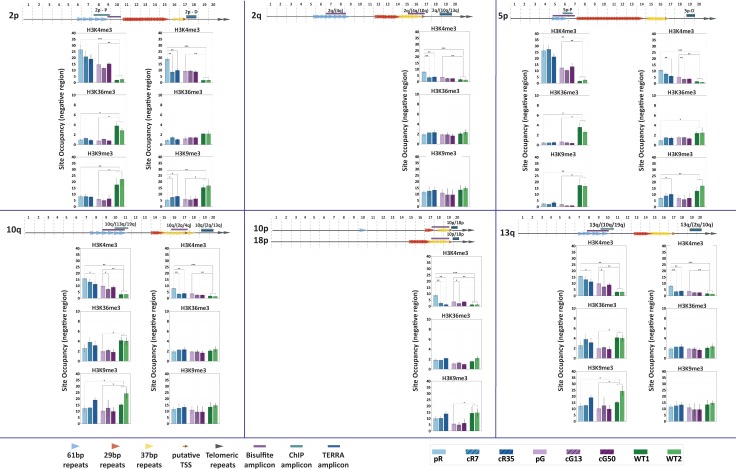
Figure 7. H3K4me3 enrichment influences de novo methylation at subtelomeric regions.
(A) Enrichment for H3K4me3, H3K36me3 and H3K9me3 at subtelomeres was determined by ChIP assay for ICF original and corrected iPSCs and WT iPSCs. Enrichment of these histone marks was assayed at TERRA promoters depicted on the right, as well as at satellite 2 repeats. Subtelomeres 2p and 5p were analyzed with the upstream 2p-P and 5p-P primer sets (Figure 3A and Supplementary file 3. Fold change in site occupancy was determined in relation to the following control regions amplified in the same samples: Hoxa7 TSS, Myoglobin exon 2 and GAPDH promoter for H3K4me3, H3K36me3 and H3K9me3 marks, respectively (See also Figure 7—figure supplement 1). Bars and error bars represent means and SEM of at least three experimental repeats. (B) Pharmacological inhibition of H3K4 MLL methyltransferase with OICR-9429 treatment. Left panel: H3K4me3 enrichment at subtelomere 2p (analysis of region 2p-P) determined by ChIP in uncorrected (pG) and corrected (cG13) iPSCs, either with (+) or without (-) OICR-9429 treatment. Fold enrichment was calculated by normalizing the percentage of input to the IgG negative control. Right panel: Boxplots showing the distribution of delta values calculated by comparing the CpG methylation levels obtained by targeted bisulfite sequencing in treated vs. untreated samples for subtelomeres 2p, 2q/4q, 4p, 5p, 7q, 9p/Xq, 10p/18 p and 10q. Note that a unique primer set, designated by d in Supplementary file 1, was used in this experiment to amplify subtelomeres 10q, 2q and 4q. Statistical analysis for ChIP was performed using a two-tailed Student’s t-test. Statistical analysis of methylation data was performed by two-tailed Mann-Whitney U-tests (*=p value<0.05, **=p value<0.01).


