Figure 2.

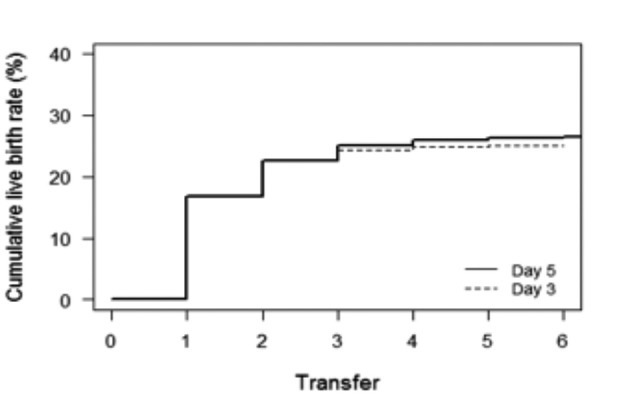
Cumulative incidence plot: Cumulative live birth rates per oocyte collection cycle in relation to transfer day. Graph depicts the time to pregnancy, expressed by the number of embryo transfers required.

Cumulative incidence plot: Cumulative live birth rates per oocyte collection cycle in relation to transfer day. Graph depicts the time to pregnancy, expressed by the number of embryo transfers required.