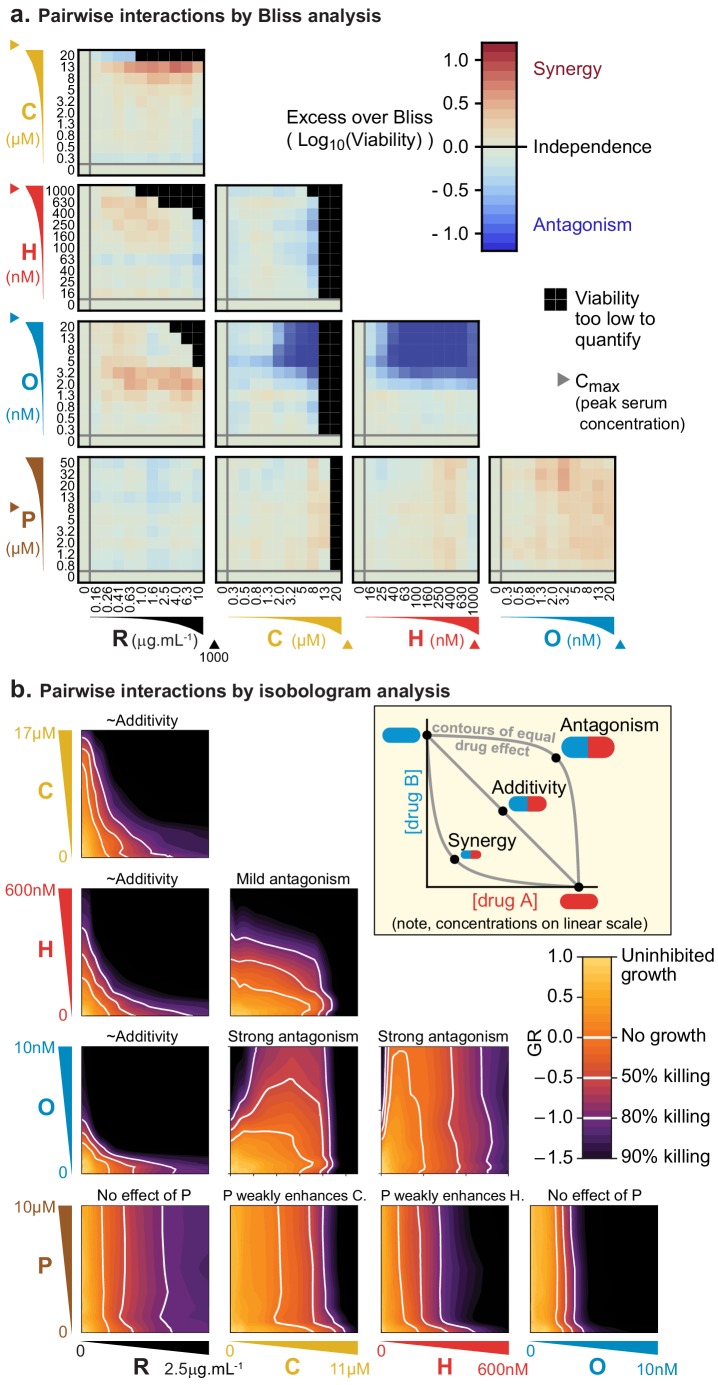
(
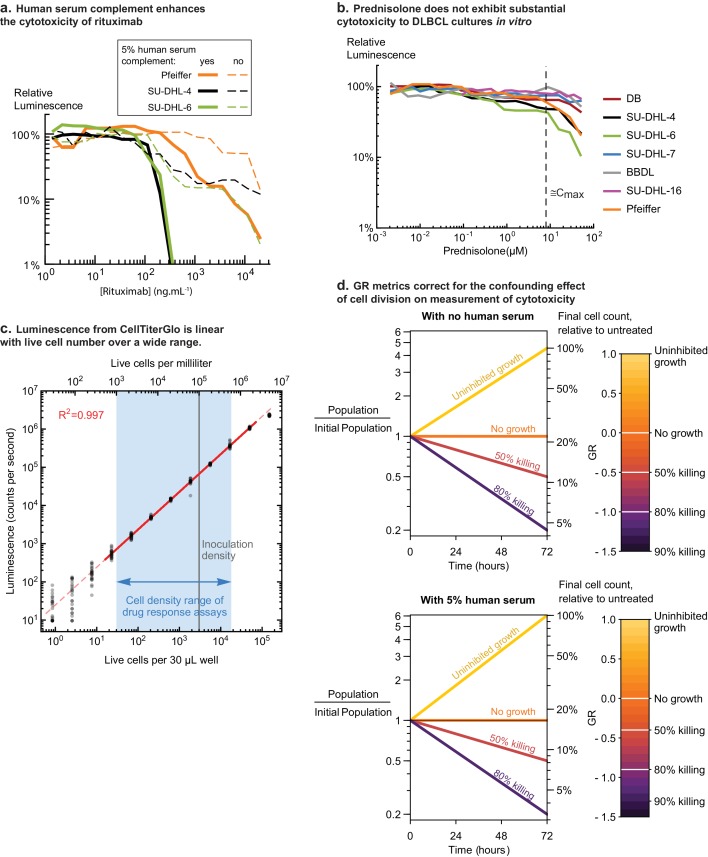
a) Human serum complement enhances the cytotoxicity of rituximab to DLBCL cell lines. The DLBCL cell lines Pfeiffer, SU-DHL-4, SU-DHL-6 were each seeded in 384-well plates at 10
5 cells/mL in complete media with or without 5% pooled human complement serum, and were treated with a range of rituximab concentrations. After 72 hr treatment, cell viability was measured by luminescent assay of ATP (CellTiter-Glo). Untreated control wells defined 100% relative luminescence. (
b) Prednisolone does not exhibit substantial cytotoxicity to DLBCL cultures in vitro. DLBCL cultures were seeded in 384-well plates, treated with prednisolone for 72 hr, and relative viability was assayed by CellTiter-Glo. None of 7 cell lines demonstrated cytotoxicity at clinically relevant doses (dashed vertical line marks the estimated Cmax of 8 μM). Because untreated cultures divide ~2 to 3 times in 72 hr, reduction of luminescence to ~50% of untreated control indicates a partial reduction in proliferation rate and not net cytotoxicity. Note: SU-DHL-7 has been identified as a descendent of SU-DHL-8, which is also a DLBCL culture. (
c) Luminescence from CellTiter-Glo is linear with live cell number over a wide range. Pfeiffer cells were concentrated by centrifugation and resuspended in a reduced volume of media, and the density of live cells was counted using a haemocytometer and trypan blue staining. This culture was seeded in 384-well plates with a volume of 30 μL per well of complete media and cell densities ranging from 5 × 10
6 down to 50 cells per mL, prepared via serial dilution. 24 replicate wells were prepared at each density. Immediately after inoculation, the plate was subjected to a luminescent assay of ATP by CellTiter-Glo. A solid red line represents the region of highly linear relationship between live cell density and luminescence (R
2 = 0.997); at higher densities luminescence begins to saturate, and at lower densities significant noise is observed. A vertical gray line indicates the initial cell density used in drug response assays (
Figures 1 and
2), and a blue shaded region indicates the cell density range relevant to these assays. (
d) Growth Rate (GR) metrics correct for the confounding effect of cell division on cytotoxicity. Cell division during a drug treatment assay affects the relationship between cell death and cell count relative to untreated controls (
Hafner et al., 2016). To correct for this effect, absolute cell counts of untreated cultures were measured before and after treatment to quantify cell proliferation (Materials and methods). Plots indicate the relation between relative cell number (measured by CellTiter-Glo) and fraction of cells killed. The ‘no human serum’ scale is relevant to pairwise interactions in CHOP (
Figure 1), and ‘5% human serum’ is relevant to pairs of R and others drugs in CHOP (
Figure 1) and all measurements of high-order interactions (
Figure 2). Similar relationships were measured and applied for SU-DHL-4 and SU-DHL-6.


