(
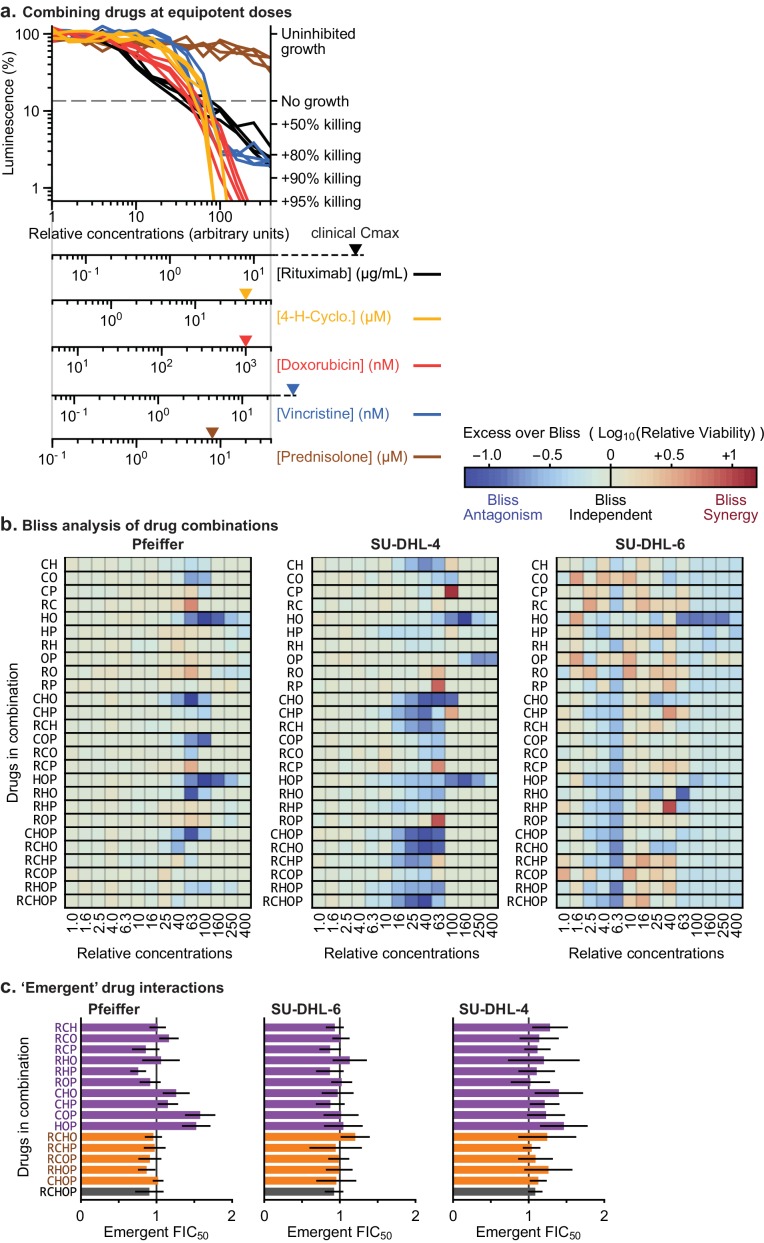
a) Combining the drugs in R-CHOP at equipotent ratio. In order to measure high-order interactions in R-CHOP (
Figure 2 and
Figure 2—figure supplement 1B,C), it was necessary to combine agents in equipotent ratio, that is mixing them in proportions that permit each drug to contribute similarly to cytotoxicity (except for prednisolone which does not display single-agent cytotoxicity in vitro). Plotted here are dose responses to each single drug as measured in the experiments of
Figure 2 for Pfeiffer (n=8; including two biological duplicate cultures, here plotting four lines per drug that are each the mean of technical duplicates). For each drug, a 400-fold dose range was selected (see axes below the plot) to align all 4 cytotoxic agents (rituximab, 4-hydroperoxy-cyclophosphamide (4-H-Cyclo.), doxorubicin, and vincristine) such that they enter the cytotoxic regime of their dose response (crossing the dashed gray line) at similar positions and that this position aligns with the clinical Cmax (peak serum concentration) of prednisolone. This alignment defines the 'relative concentration' units in
Figure 2C. The concentration range also aligns the clinical Cmax (colored triangles on concentration axes) of each drug, except for rituximab which is very highly potent against Pfeiffer cells. Relative luminescence (left axis) was converted to biological effect (right axis) by measuring absolute cell count of untreated cultures before and after drug treatment (Materials and methods): in this experiment untreated cultures increased in cell count by approximately 7-fold, and therefore relative luminescence of ≈14% corresponds to no net growth or death (“no growth” on axis). A net cytotoxic effect is evidenced only by relative luminescence lower than 14% (e.g. +50% killing at ≈7% luminescence, +80% killing at ≈3% luminescence). Similar 400-fold dose windows were independently determined for SU-DHL-4 and SU-DHL-6. (
b) High-order interactions of R-CHOP analyzed according to the Bliss Independence model in 3 DLBCL cell lines using data from
Figure 2. The Bliss Independence model defines toxins to be ‘non-interacting’ when they confer statistically independent probabilities of cell death, thus, surviving fractions of cells are multiplied (e.g. 90% inhibition by drug A + 90% inhibition by drug B should produce 99% inhibition in combination). The ‘Excess over Bliss’ measures the observed deviation from the Bliss Independence model: in these heat maps blue indicates antagonism (less killing), and red indicates synergy (more killing). See legend above the 'SU-DHL-6' graph. The combination of all 5 drugs in R-CHOP shows neither synergy nor antagonism, being consistent with Bliss independence (bottom row of panels). (
c) Emergent high-order interactions of R-CHOP analyzed using fractional inhibitory concentrations at 50% killing threshold (FIC
50) in 3 DLBCL cell lines. Emergent FIC quantifies any deviation in the potency of 3, 4, or 5-way combinations from the assumption of additivity between known lower-order interactions (
Cokol et al., 2017). FIC is the sum of each drug’s concentration in that mix as a fraction of their single-agent dose producing the same effect:
; and Emergent FIC
(e.g. for three drugs ABC: FIC
ABC / average(FIC
AB, FIC
AC, FIC
BC). Error bars are 95% confidence intervals (n=8 per dose point for single-drug dose responses, n=4 per dose point for multi-drug dose responses).


