(
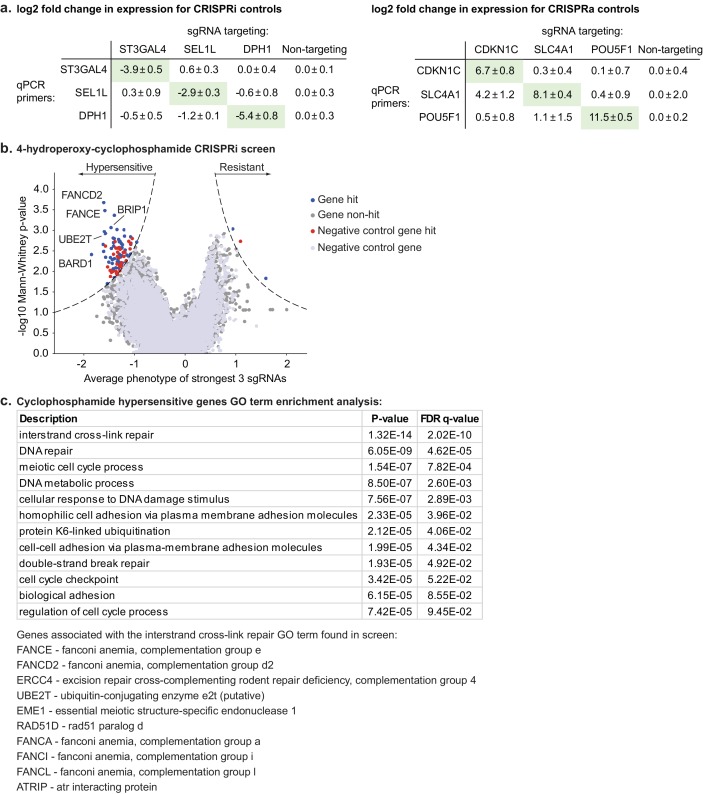
a) CRISPRi targeting of 3 control genes results in knockdown in Pfeiffer cells (left) and CRISPRa targeting of 3 control genes results in overexpression in K562 cells (left). On-target effect is strong (green shaded boxes) whereas off-target and/or indirect effects are either weak or undetectable. Cell lines expressing either the CRISPRi or CRISPRa system were transduced with sgRNAs targeting control genes. The expression of control genes was measured in those cell lines by RT-qPCR using gene-specific primers and was compared to a non-targeting control sgRNA (Materials and methods). (
b) Volcano plot of gene phenotype and enrichment p-value for the CRISPRi screen of 4- hydroperoxy-cyclophosphamide performed at a lower concentration (as compared to
Figure 5). The position of each gene was determined by the average phenotype of the three most active sgRNAs (out of a library of 5 sgRNAs per gene) and -log
10 of the p-value determined using the Mann-Whitney test of all sgRNAs targeting that gene compared to non-targeting controls. For genes with multiple transcription start sites (TSSs) targeted, sgRNAs were grouped by TSS and the TSS with the lowest p-value was used for display and downstream analysis. Negative control genes were generated by randomly grouping sets of 5 non-targeting controls which were subsequently analyzed as true genes. Dashed lines represent a cutoff ≥7 as calculated from: (gene phenotype z-score)×(-log
10(p-value)) and where the z-score is calculated from the standard deviation of the set of negative control genes. (
c) Table containing the top hits from a gene ontology analysis performed on the CRISPRi hypersensitive hits. A hypersensitivity score was calculated for each gene by multiplying the two metrics determined in the screen (score = -log
10(p-value) × gene phenotype). Gene ontology analysis was performed on the list of genes ranked by hypersensitivity score using GOrilla (
Eden et al., 2009). Reported p-values are the enrichment p-values computed according to the GOrilla algorithm and the 'FDR q-values' represent the correction of the p-values for multiple testing hypothesis. A list of all genes belonging to the GO term 'interstrand cross-link repair' and which were found as hypersensitive in the CRISPRi cyclophosphamide screen is reported below the table.


