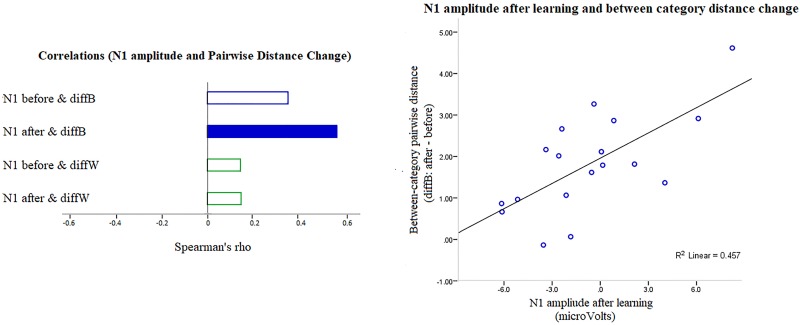
Fig 10. The relationship between N1 and CP separation in Learners.
Left: Spearman rank order correlations between N1 amplitude before and after learning and changes in pairwise distance between (diffB) and within (diffW) categories. The only significant correlation is the dark bar. Right: Scatter plot for the significant correlation: Decreased N1 amplitude (peaks that were less negative) predicted an increase in between-category distance.

