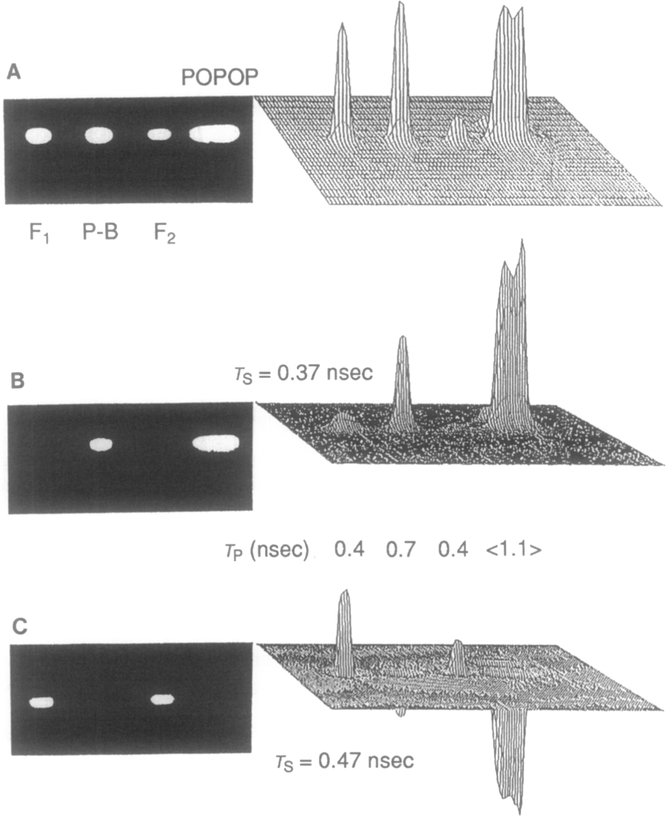
Fig. 10.
Phase-suppressed images of free and protein-bound NADH. (A) Phase-sensitive intensity image of samples (F1 and F2, NADH free; P-B, NADH bound to protein; POPOP, standard fluorophore used for lifetime calculation). (B) Difference image with a suppressed lifetime of 0.37 nsec. (C) Difference image with a suppressed lifetime of 0.47 nsec.

