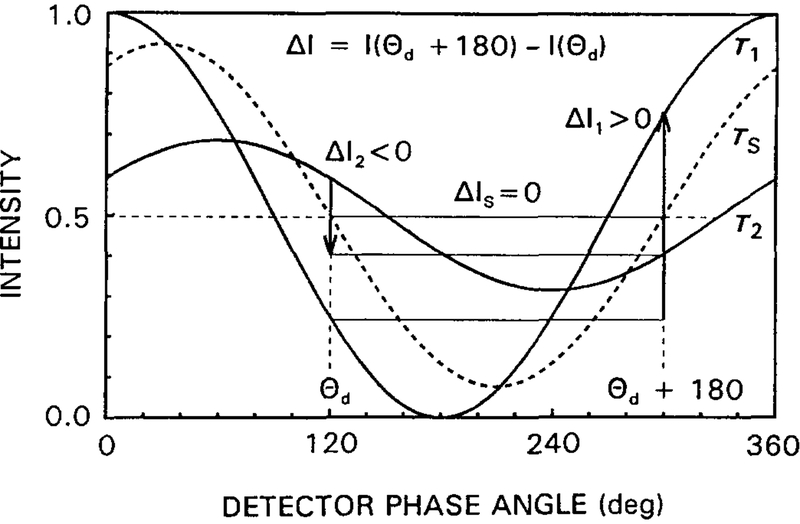
Fig. 9.
Intuitive description of phase suppression. In a difference image with ΔI = I(θD + 180°) − I(θd), a component with τ = τS is completely suppressed (ΔIS = 0). Components with longer lifetimes (τ2) appear as negative values (ΔI2 < 0), and those with shorter lifetimes (τ1) appear to be positive (ΔI1 > 0).

