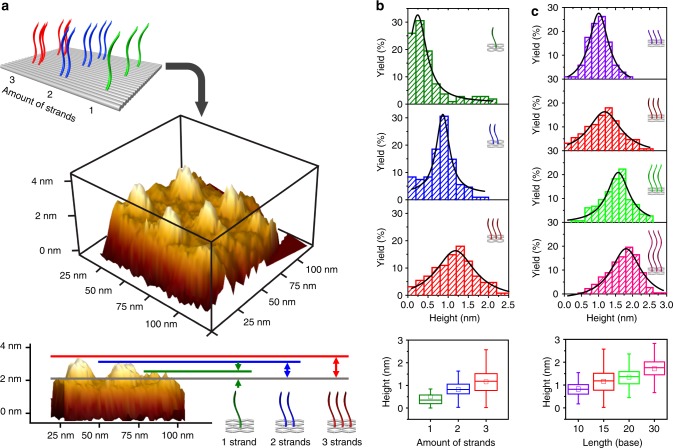
Fig. 2.
Number and length effects of pcDNA on DCIMP. a AFM 3D reconstruction (top) and side view (bottom) of a metalized rectangular origami having eight discrete sites with varied numbers of 15-base pcDNA strands. b Distribution of increased height values and statistic analysis of height increase on sites with varied number of strands. The error bars are the standard deviation for N = 108, 108 and 128 samples with different number of strands. c Distribution of increased height values and statistic analysis of height increase on sites with varied length of pcDNA strands. The error bars are the standard deviation for N = 103, 128, 147 and 225 samples with different length of pcDNA strands.

