Figure 4.
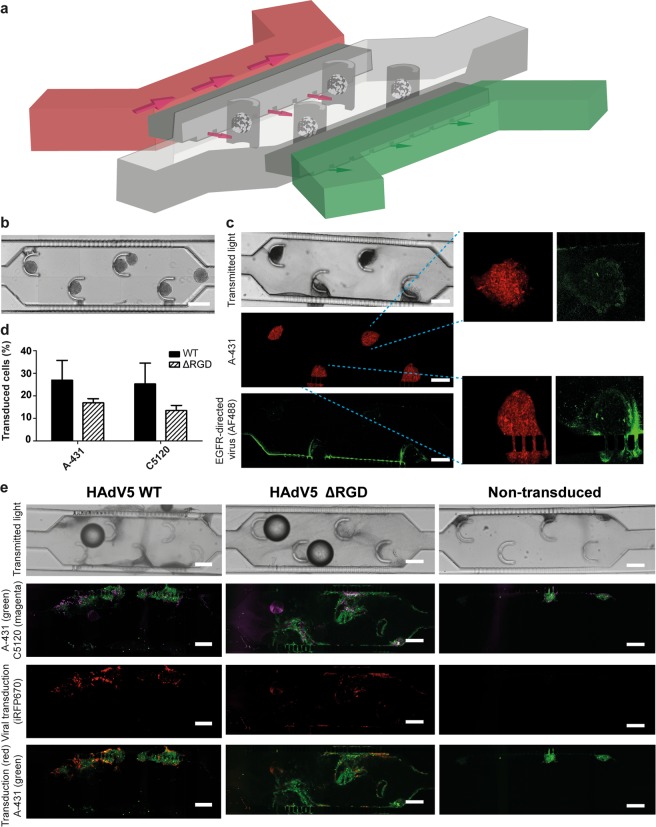
A tumor-on-a-chip device designed for capturing tumor spheroids and investigating viral transduction on-chip. (a) Schematic 3D representation of the tumor-on-a-chip device. The main tumor compartment with spheroid-capturing posts is indicated in grey, with capillary and lymph-mimicking channels in red and green, respectively. The outlet of the capillary-mimicking channel is connected to a tunable resistance chip (See Supplementary Fig. S6). Not drawn to scale. Supplementary Fig. S6 provides a drawing to scale. (b) Reconstructed image of the tumor compartment of the tumor-on-a-chip device freshly loaded with co-culture spheroids. The scale bar is 300 µm. (c) On-chip visualization of the trafficking of the retargeted adenovirus. Confocal microscopy images of tumor spheroids embedded in collagen on-chip perfused with Alexa Fluor 488-labelled, EGFR-retargeted adenovirus are shown. Tumor cells were stained with CellTrace Far Red. The green ridge indicates the interface between medium and the collagen gel where viral particles accumulate. Insets indicate viral particles enriched on the outer rim of the spheroids. The scale bar is 300 µm. High-resolution images of the viral particle enrichment at the spheroid rim are provided in Supplementary Fig. S7. (d) Quantification of the cellular transduction on-chip. The fraction of the virus-transduced A-431 and C5120 cells was determined via image analysis using Fiji software and plotted. Error bars reflect the s.e.m, n = 3. (e) On-chip transduction of tumor spheroids with EGFR-retargeted HAdV5 with or without the RGD motif. Confocal microscopy images of on-chip optically cleared tumor spheroids transduced with EGFR-retargeted HAdV5 (with and without RGD) and non-transduced controls are shown. C5120 fibroblasts were labelled with CellTrace Yellow (magenta), A-431 cells were labelled with CFSE (green). iRFP670 (red) was used for detection of the virus-transduced cells. Representative images from three independent experiments are shown. The scale bars are 200 µm.

