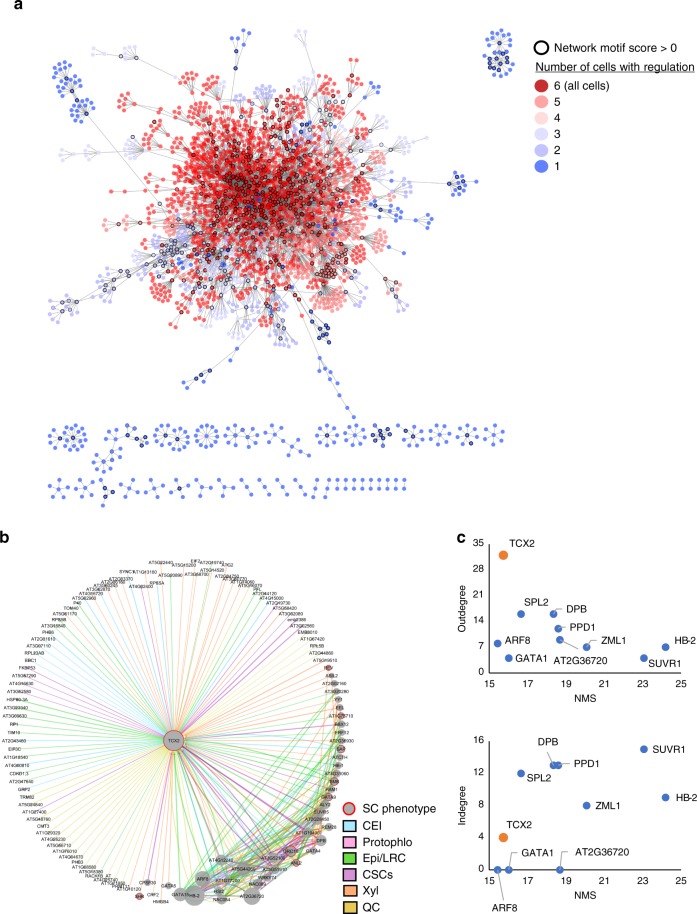
Fig. 2.
Gene regulatory network (GRN) of the stem cell-enriched genes. a Inferred GRN of 2982 out of the 9266 stem cell-enriched genes. Genes are colored based on the number of genes in which they are enriched, with red genes (>3 enriched cells) considered stem-cell-ubiquitous and blue genes (≤3 enriched cells) considered stem-cell-specific. Black outlines represent hub genes which have a network motif score (NMS) > 0. b First-neighbor GRN of TCX2. Gene size represents the NMS score. Red borders represent the genes which have a known stem cell (SC) phenotype. Edge colors represent the cell in which the regulation is inferred. Blue—CEI; Pink—Protophlo; Green—Epi/LRC; Purple—CSCs; Orange—Xyl; Yellow—QC. c Outdegree (top plot) and indegree (bottom plot) vs NMS score of the genes with the top 10 NMS scores in a. TCX2 is highlighted in orange.

