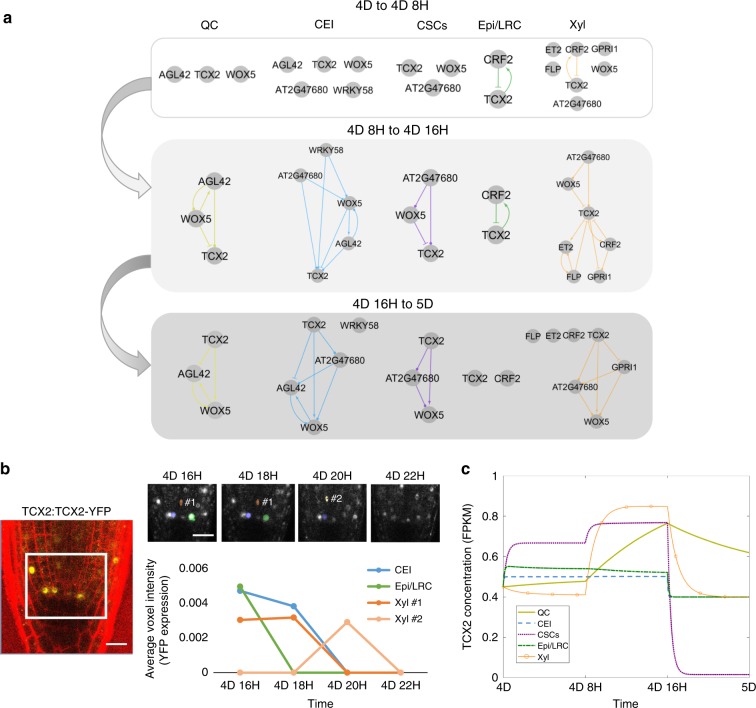
Fig. 4.
Mathematical modeling of TCX2 network predicts timing of cell division. a TCX2 first-neighbor TF networks predicted using RTP-STAR on the stem cell time course for 4 day (4D) to 4 days 8 h (4D 8H) (top), 4D 8H to 4D 16H (middle), and 4D 16H to 5D (bottom). Networks are separated based on the cell type the genes are expressed in: QC (yellow), CEI (blue), CSCs (purple), Epi/LRC (green), Xyl (orange). Arrows represent predicted activation, bars inferred repression, and circles no inferred sign. b (left) Representative image of TCX2:TCX2-YFP at 4D 16H. White box represents the stem cell niche were cells were tracked over time. Scale bar = 20 µm. (right, top) YFP-positive cells tracked every 2 h from 4D 16H (left) to 4D 20H (right). Stem cells that were tracked are marked in blue (CEI), green (Epi/LRC), and orange (Xyl). Two Xyl cells were tracked, #1 and #2. All of these four stem cells had no measurable YFP expression at 4D 22H. (right,bottom) Quantification of YFP expression in tracked cells. c ODE model prediction of cell-specific TCX2 expression from 4D to 5D. FPKM: fragments per kilobase per million mapped reads.

