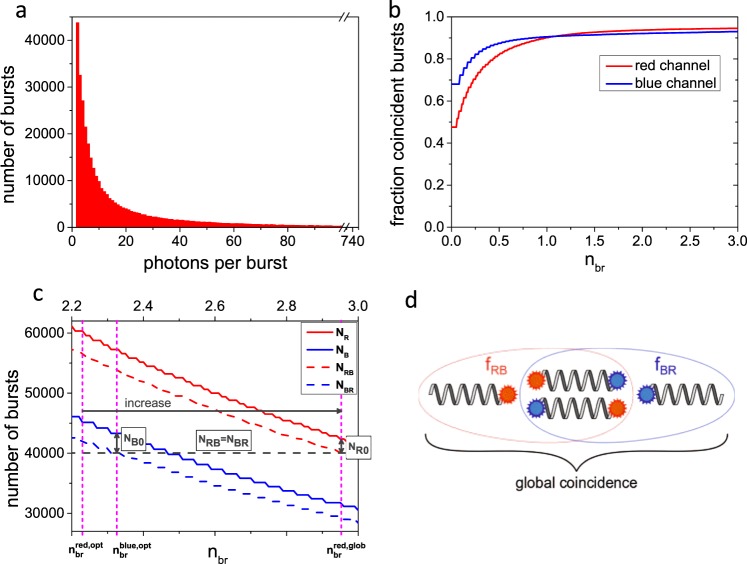
Fig. 2. Benchmark of brightness-gated two-color coincidence detection with single dye pair dsDNA reference.
a Histogram of number of photons per burst for red channel (Atto 647N). b Fractions of coincident bursts as a function of normalized brightness threshold nbr. Obtained saturated coincidence fractions are 0.94 and 0.92 for red and blue channel, respectively. Burst and analysis statistics are given in Supplementary Notes 1 and 2. c Concept of global coincidence analysis. Number of selected red and blue bursts (solid lines) and those which show coincidence with the complementary color (dashed lines) are shown as a function of brightness threshold nbr. The optimal brightness threshold nbr,opt is depicted for each color separately (see Supplementary Note 5). The brightness threshold of the color with the higher number of coincident bursts is increased (here red) until the number of coincident bursts are equal, i.e. NRB = NBR as indicated by the gray dashed line. The number of red-only and blue-only bursts NR0 and NB0, respectively, are indicated by arrows. d Differentiation between color-specific coincidence fractions and global coincidence.

