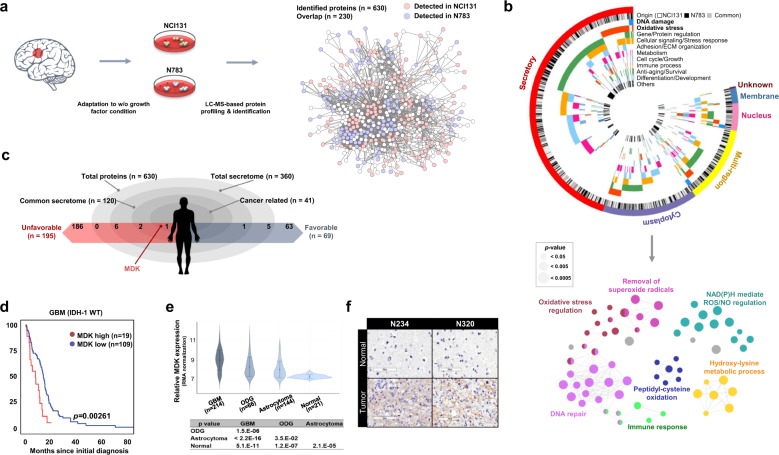
Fig. 1. Identification of autocrine factors through the secretome analysis.
a A schematic diagram describing the experimental procedures. b A Circos plot showing the subcellular localization, source and functional classification based on Gene Ontology (GO) analysis using the DAVID web tool (top). ClueGO analysis for functionally grouped networks of enriched categories for representative biological processes. The node size indicates the significance of the term p value corrected via the Bonferroni step down approach (bottom). c A schematic demonstrating the stratification of identified proteins. The association with cancer and the prognostic influence were determined using the DAVID web tool (GAD disease class, cancer) and the Human Protein Atlas web tool, respectively. d Kaplan−Meier analysis of survival in a dataset of IDH-1 wild-type (WT) GBM patients from The Cancer Genome Atlas (TCGA) according to their MDK level. e MDK mRNA expression level across normal brain and glioma specimens with different histological grades in a Rembrandt dataset. f Immunohistochemical analyses of MDK expression in GBM specimens. The bar represents 100 µm.

