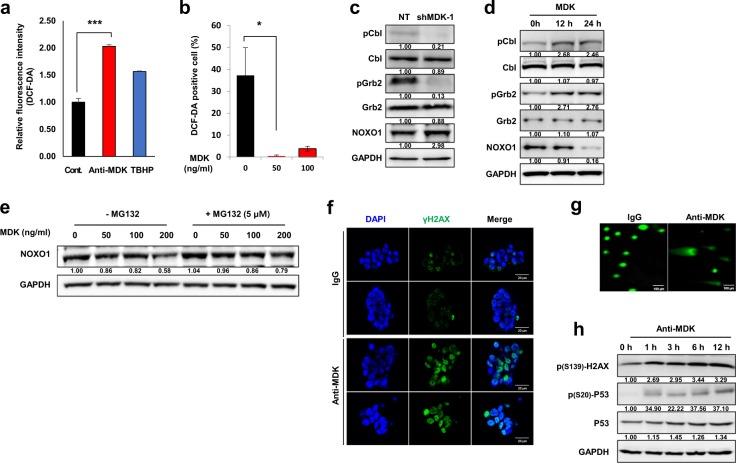
Fig. 4. The effect of MDK inhibition on oxidative stress-induced DNA damage.
a Relative fluorescence intensities upon dichlorofluorescein diacetate (DCF-DA) treatment in the control, anti-MDK (5 µg/ml, 4 h), and tert-butyl hydroperoxide (Sigma, TBHP, 50 µM, 4 h) treated groups are shown as bar graphs. TBHP was used as the positive control for the ROS source. b The percentage of DCF-DA-positive cells upon treatment with recombinant MDK at the indicated doses for 6 h is shown in the bar graph. c Immunoblots of the indicated proteins in NCI827 cells transfected with nontargeting (NT) shRNA or shMDK or d treated with recombinant MDK (50 ng/ml) for 0, 12 or 24 h are shown. The data are representative of three independent experiments. e Western blot analyses of NOXO1 in NCI827 tumor spheres upon treatment with recombinant MDK at the indicated doses with or without MG132 (5 µM for 6 h) under the influence of cycloheximide (12.5 µg/ml) are shown. The data are representative of three independent experiments. f Immunofluorescence analysis to detect γH2AX (green) and/or DAPI (blue) in NCI827 cells treated with control IgG or the anti-MDK antibody (5 µg/ml each for 5 h) is shown. The scale bars represent 20 µm. The data are representative of three independent experiments. g Comet assay in NCI827 cells treated with IgG (left) or the anti-MDK antibody (5 µg/ml each). The scale bars indicate 100 µm. The data are representative of three independent experiments. h Western blot analyses of the indicated proteins upon treatment with the anti-MDK antibody (20 µg/ml) for the indicated times are shown. The data are representative of three independent experiments. *p < 0.05, **p < 0.01, and ***p < 0.001.

