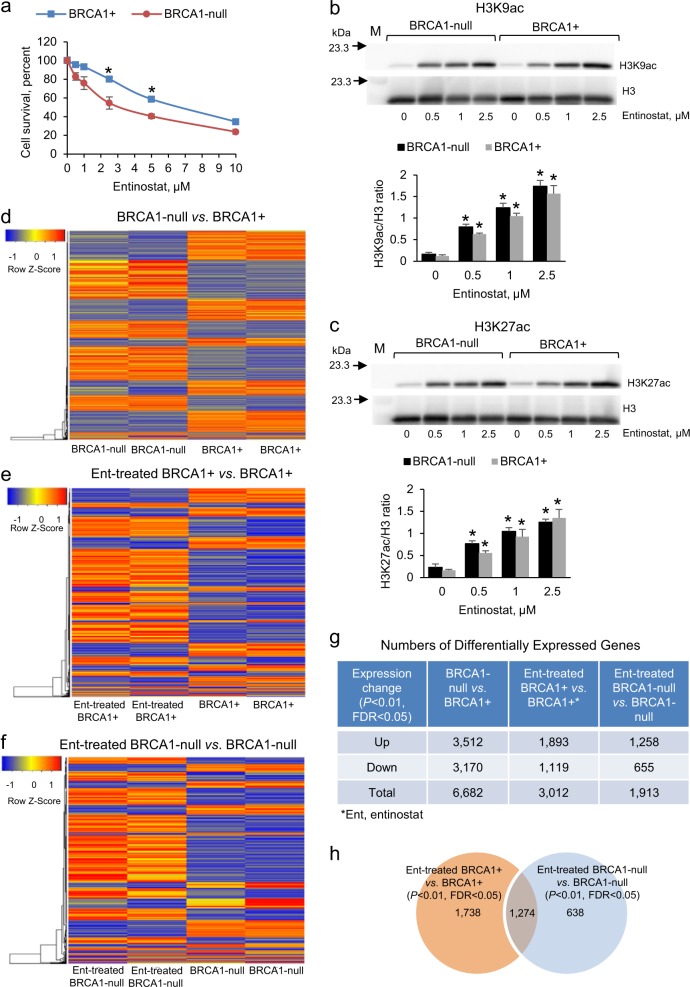
Fig. 1.
Gene expression changes associated with BRCA1 mutation in ovarian cancer (OC) cells. a Survival (means ± s.e.m., n = 4) measured by the CCK8 assay of UWB1.289 OC cells (BRCA1-null) and UWB1.289 cells transfected with BRCA1 (BRCA1+) and treated with entinostat for 72 h. *P < 0.05 (t-test). b, c Western blot and densitometric analysis (means ± s.e.m., n = 3) of entinostat effects (72 h treatment) on H3K9ac b and H3K27ac c levels in BRCA1-null and BRCA1+ UWB1.289 OC cells. *P < 0.05 (t-test) relative to 0 entinostat. M, protein markers. d–f Unsupervised hierarchical clustering of differentially expressed genes measured by RNAseq between BRCA1-null and BRCA1+ d, entinostat-treated BRCA1+ compared with BRCA1+ e, and entinostat-treated BRCA1-null compared with BRCA1-null f UWB1.289 OC cells. Colored horizontal lines represent genes and columns represent specimens analyzed. Cells were treated with 0.5 μM entinostat for 24 h (n = 2). g Numbers of differentially expressed genes in BRCA1-null relative to BRCA1+UWB1.289 OC cells treated with 0.5 μM entinostat for 24 h (n = 2). h A Venn diagram shows numbers of common and unique differentially expressed genes determined by RNAseq in BRCA1+ and BRCA1-null UWB1.289 OC cells treated with 0.5 μM entinostat (Ent) for 24 h (n = 2).

