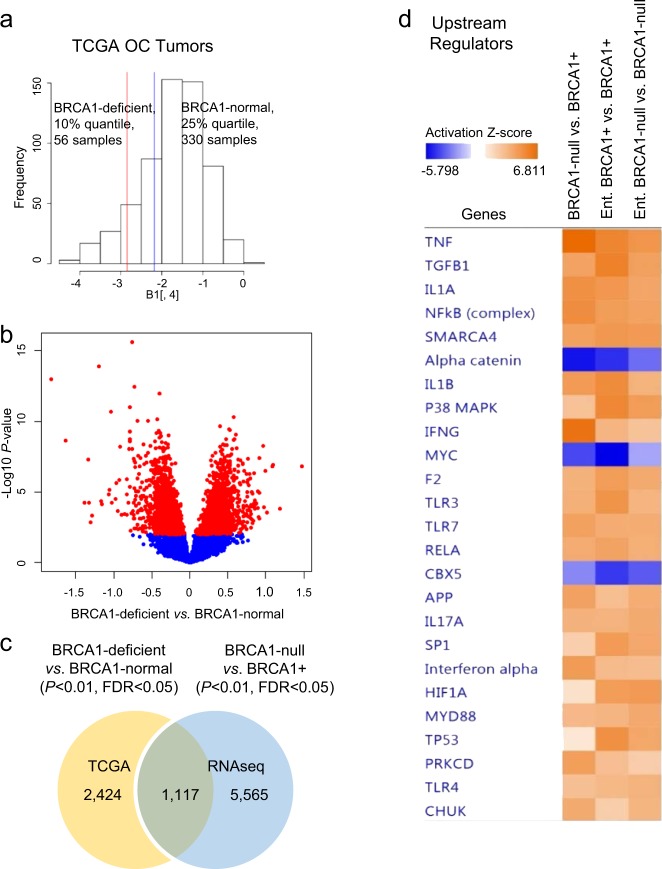
Fig. 2.
Gene expression profiles associated with BRCA1 expression levels in ovarian cancer (OC) tumors. a Distribution of BRCA1 mRNA expression levels in high-grade serous ovarian cancer (HGSOC) specimens from the TCGA dataset. The upper 25% quantile (blue line to the right) were considered BRCA1-normal while the low 10% quantile (red line to the left) were considered BRCA1-deficient. b Volcano plot of differentially expressed genes between BRCA1-deficient and BRCA1-normal HGSOC tumors in the TCGA database. c Venn diagram shows the numbers of specific or shared genes differentially expressed between BRCA1-deficient and BRCA1-normal OC tumors (TCGA) and between BRCA1-null and BRCA1+ UWB1.289 OC cells. d IPA comparative analysis shows activation Z-scores of differentially expressed upstream regulators in BRCA1-null relative to BRCA1+ UWB1.289 OC cells, and in the same cell lines in response to entinostat treatment (0.5 μM for 24 h, n = 2).

