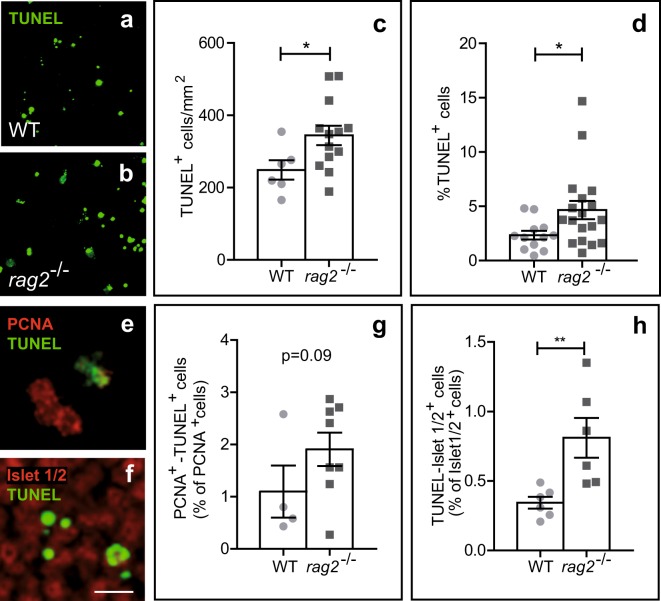
Figure 3.
Neuronal cell death is increased in E13.5 rag2−/− retinas. (a,b,e,f) Apoptotic cells as visualized by TUNEL (green) in WT and rag2−/− mouse retinas. Density of TUNEL+ nuclei in whole-mount retinas (c) and percentage of TUNEL+ cells in dissociated retinal cells (d) are shown. (e,g) Dissociated retinal cells were immunostained for PCNA (red) and processed for TUNEL (green), and labelled cells were scored. (f,h) Apoptotic neurons were scored in whole-mount retinas immunostained for Islet 1/2 (red) and processed for TUNEL. Histograms show the mean ± SEM values. *P < 0.05, **P < 0.01 vs. corresponding controls. Individual values are depicted as circles (WT) and squares (rag2−/−). Scale bar, 50 µm in a and b, 12 µm in e and f.

