Fig. 2.
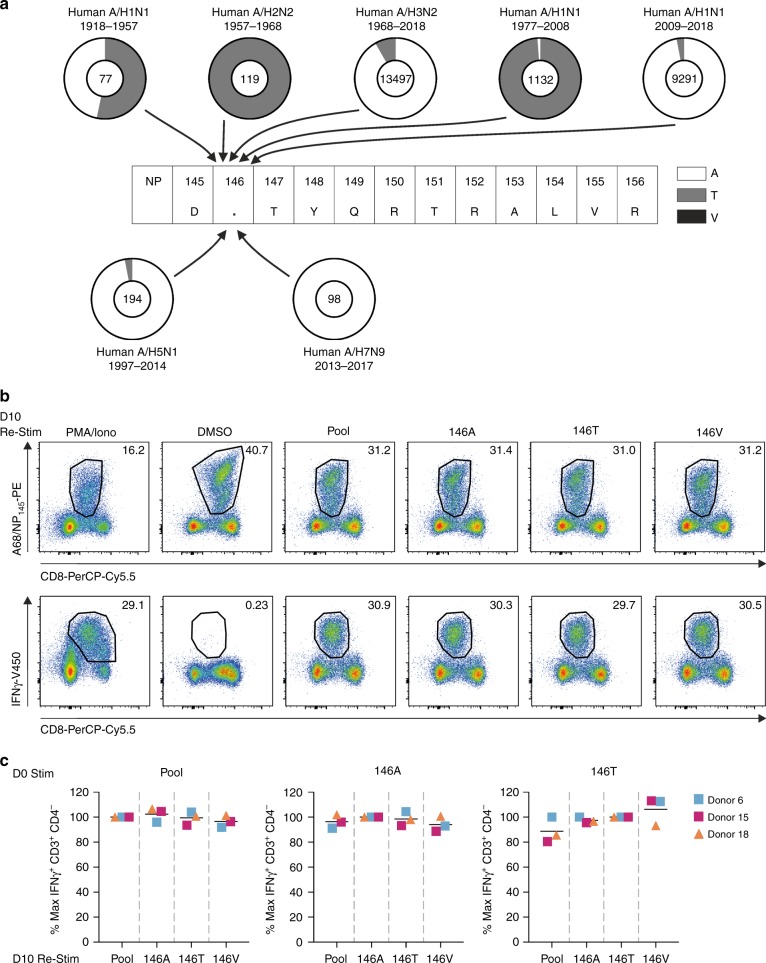
High conservation of the NP145-156 peptide across seasonal IAV viruses. a Frequency of amino acid variation at position 146 of the NP145–156 peptide. Pie charts represent frequency of alanine (A; white), threonine (T; gray) and valine (B, black) at position 146. Total number of analyzed sequences are indicated in the pie charts: A/H1N1 (1918–1957 n = 77, 1977–2008 n = 1132, 2009–2018 n = 9291), A/H2N2 (1957–1968 n = 119), and A/H3N2 (1986–2018 n = 13,497), avian A/H5N1 (1997–2014 n = 194) and A/H7N9 (2013–2017 n = 98). b Representative FACS panels of A68/NP145-specific CD8+ T cells expanded by 146A peptide stimulation on day 0, followed by restimulation at day 10 with cognate or variant NP145 peptides. Day 10 restimulation with PMA/Ionomycin was included as a positive control and DMSO as a negative control. c Percentage of maximum IFNγ+CD3+CD4− T cells following secondary stimulation. Maximum IFNγ is defined as IFNγ+CD3+CD4− T cells following cognate restimulation with peptide pool (pool), DATYQRTRALVR (146A), DTTYQRTRALVR (146T) or DVTYQRTRALVR (146V) peptides, respectively. Pool included 146A, 146T, and 146V variants. The bar indicates the mean response of three donors (n = 3).

