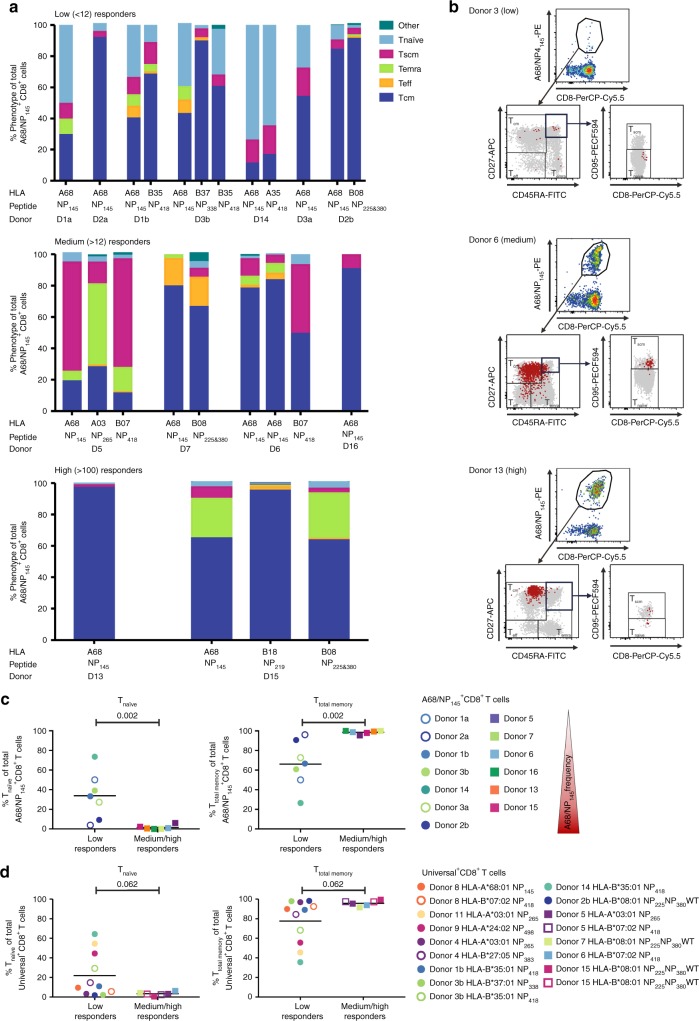
Fig. 4.
Phenotypes of A68/NP145-specific and universal influenza-specific CD8+ T cells. a Phenotypes of A68/NP145- and universal influenza virus-specific CD8+ T cells of low (<12 A68/NP145-specific CD8+ T cells/106 CD8+ T cells) (n = 4), medium (>12) (n = 4), and high (>100) responders (n = 2). b Representative FACS panels indicate the gating strategy used to characterize A68/NP145-specific CD8+ T cell response. Representatives for A68/NP145-tetramer staining (first panel), CD27, CD45RA staining to identify Teff (CD27−CD45RA−), Temra (CD27−CD45RA+), and Tcm (CD27+CD45RA−) cells (second panel), followed by CD95, CD8 staining to identify Tnaïve-like (CD27+CD45RA+CD95−) and Tscm (CD27+CD45RA+CD95+) cells (third panel). Gray dots are total CD8+ T cells in unenriched sample, red dots are A68/NP145+CD8+ T cells in enriched sample. c Frequency comparison of Tnaïve and Ttotal memory (Tcm + Tem + Temra + Tscm) A68/NP145+CD8+ T cells in low vs. medium/high responders. We included two measurements for donor 1, 2, and 3: open symbols were used for samples collected in 2015, closed symbols for samples collected in 2018 (see also Table 1). d Frequency comparison of Tnaïve-like and Ttotal memory universal-specific CD8+ T cells in low vs. medium/high responders. c–d Bar indicates mean response of the donors. Statistical analysis was performed using a Mann–Withney test. Exact p value are indicated above the graphs.

