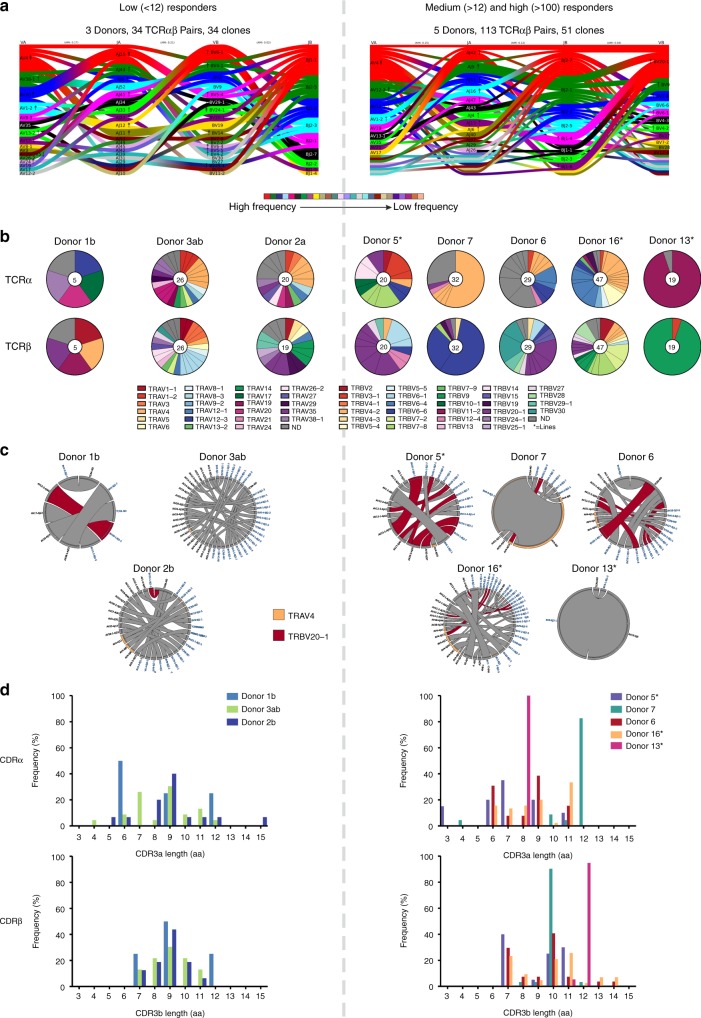
Fig. 5.
High clonal diversity in the A68/NP145-specific TCR repertoire. a Gene segment usage and pairing landscape are shown for low (n = 3) and medium/high (n = 5) responders. Each clonotype is assigned the same vertical length irrespective of clonotype size. Each vertical stack reflects V and J gene segment usage and pairing is shown by curved connecting lines. Genes are colored by frequency of distribution. Enrichment or depletion of gene usage is indicated by up or down arrows respectively where one arrowhead correlates to a twofold increase or decrease. b Pie charts of TRAV and TRBV gene usage in individual donors. Total number of analyzed gene sequences are indicated within the pie charts. c Circos plots showing the distribution of TRA-TRB paired clonotypes across donors. Each segment defines an individual clonotype and width of the segment correlates to the frequency of the clonotype. Private clonotypes are in gray. The commonly observed clonotypes shared between different donors are shown in red (TRBV20-1) and orange (TRAV4). d Distribution of CDR3α and CDRβ amino acid lengths in low and medium/high responding donors. An asterisk indicates that TCR clonotypes were established on in vitro expanded T cell lines.

