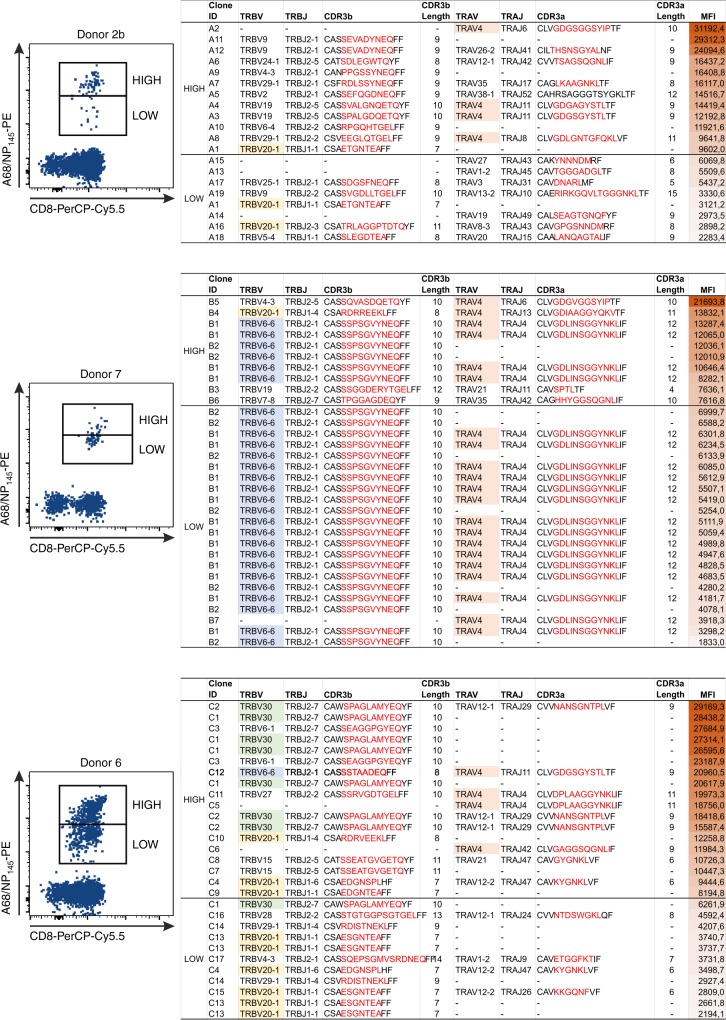
Fig. 7.
TCRαβ clonotype distribution based on A68/NP145-tetramer avidity. FACS panels (left) show gating of high and low avidity A68/NP145+ CD8+ T cells of low (donor 2b) and medium (donor 7 and 6) responders. Tables show clonotypes arranged based on A68/NP145–tetramer avidity (right). Last column in the table shows MFI of individual clonotypes, MFI gradient color from high MFI (dark red) to low MFI (white). TRBV20-1 (yellow) and TRAV4 (orange) are commonly observed clonotypes that are shared between donors, whereas TRBV6-6 (blue) and TRBV30 (green) are donor-specific clonotypes observed at high frequency.

