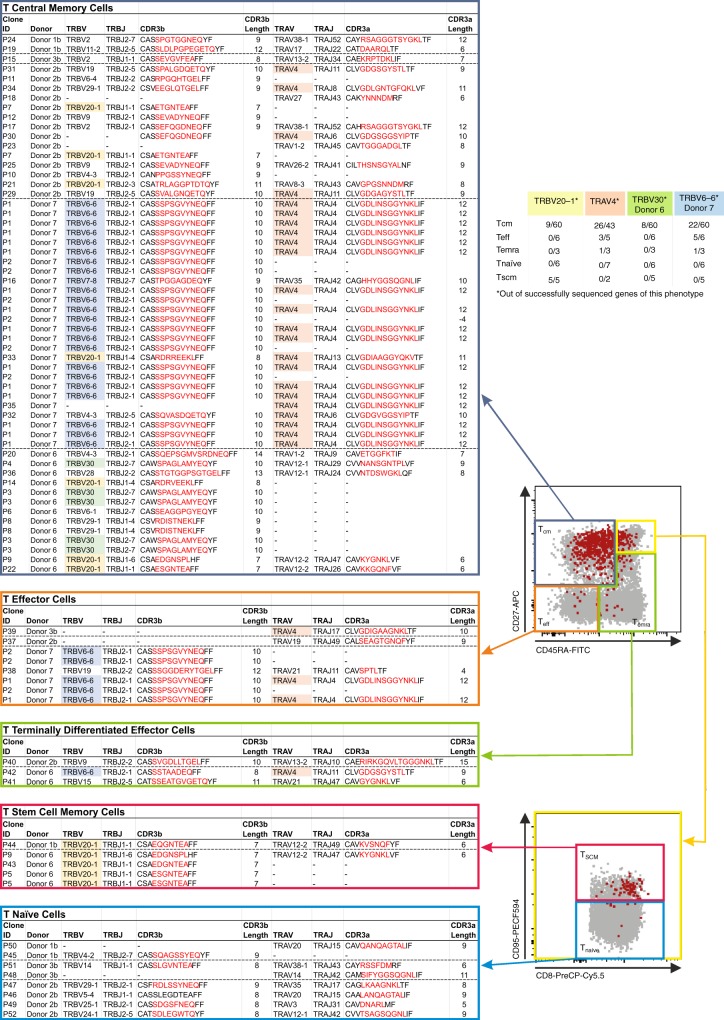
Fig. 8.
TCRαβ clonotype distribution based on their individual phenotype. FACS panels (center) indicate the gating strategy used to define Teff (CD27−CD45RA−), Temra (CD27−CD45RA+), and Tcm (CD27+CD45RA−) cells (top FACS plot) and Tnaïve-like (CD27+CD45RA+CD95−) and Tscm (CD27+CD45RA+CD95+) cells (bottom FACS plot). Gray dots are total CD8+ T cells in unenriched sample, red dots are A68/NP145+CD8+ T cells. Clonotypes of A68/NP145+CD8+ T cells are listed based on phenotype (n = 5 donors). TRBV20-1 (yellow) and TRAV4 (orange) are commonly observed clonotypes, which are shared between donors whereas TRBV6-6 (blue) and TRBV30 (green) are donor-specific clonotypes observed at high frequency.

