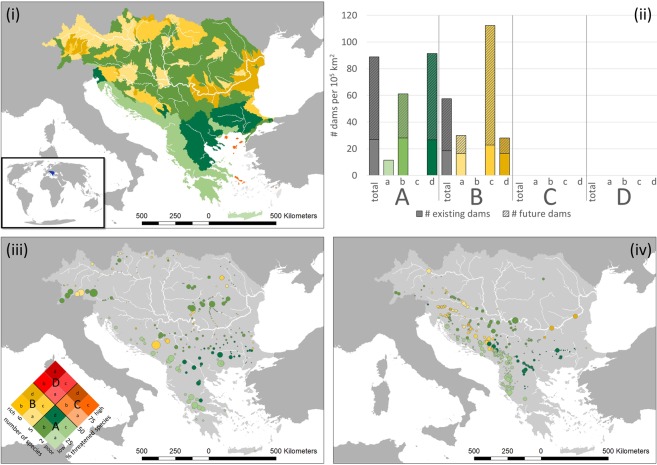
Figure 4.
Overlap of dams with freshwater megafauna species richness and share in threatened species for the Balkan area. Top: (i) Choropleth map of sub-catchments (HydroBASINS level 8) according to species richness and threat status (species presence reference scenario). (ii) “Density” of dams per 105 km2 in different sub-catchments according to richness-threat categories. Existing dams: bold colour; Future hydropower dams: striped colour. Bottom: Location of existing dams (iii) and future hydropower dams (iv) and their individual categorization according to species richness and proportion of threatened species. Size of the dots indicates size of the dam (existing: dam height in m; future: capacity in MW – not scaled). Colour code: Green (A): low richness (≤5 species), low share in threatened species (≤50%); Yellow (B): high richness (>5 species), low share in threatened species; Orange (C): low richness, high share in threatened species (>50%); Red (D): high richness, high share in threatened species. For more details, please see legend in subfigure (iii).

