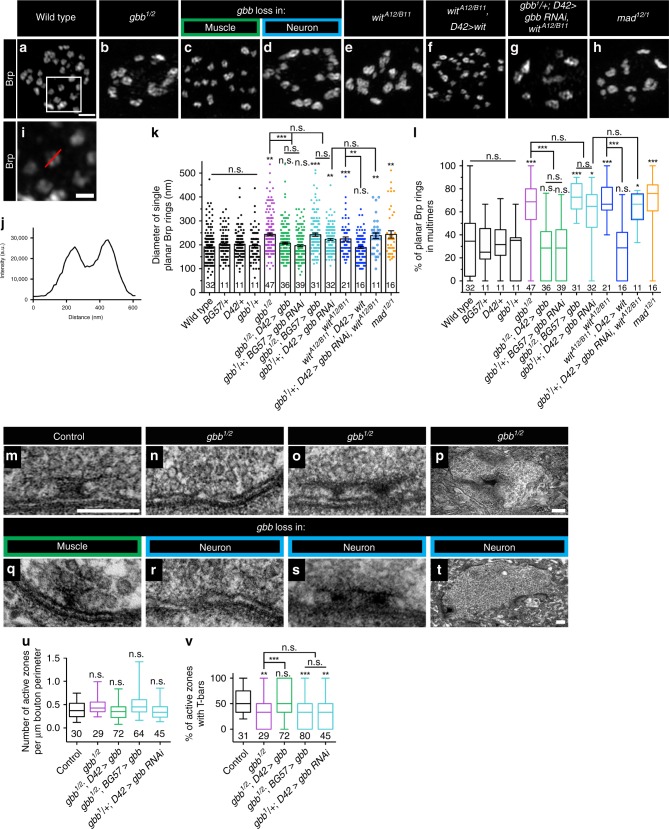
Fig. 2. Presynaptic BMP signaling regulates active zone architecture.
a–h Representative deconvolved z-projections of boutons of indicated genotypes labeled with anti-Brp. gbb loss in muscle is gbb1/2; D42>gbb, and gbb loss in neuron is gbb1/2;BG57>gbb. Scale bar: 1 µm. i Zoomed in view of the box in a, demonstrating how Brp ring diameter was measured. The red line is typical of a manually drawn line through a single planar Brp ring. Scale bar: 200 nm. j Fluorescence intensity along the line in i was plotted, and Brp ring diameter was calculated as the distance between the two intensity maxima. k Quantification of single planar Brp ring diameters. l Quantification of the percentage of planar Brp rings within multimers, or groups of interconnected Brp rings. For all Brp ring analyses, n is the number of boutons scored. m–t Representative transmission electron micrographs of active zones (m–o, q–s) or boutons (p, t) of the indicated genotypes. gbb loss in muscle is gbb1/2;D42>gbb, and gbb loss in neuron is gbb1/2;BG57>gbb. Scale bars: 200 nm. u Quantification of the number of active zones per micron bouton perimeter. n is the number of boutons scored. v Quantification of the percentage of active zones with T-bars. n is the number of active zones scored. For the bar graph, error bars are mean ± SEM. For all box-and-whisker plots, error bars are min and max data points, and the center line indicates the median. Individual data points are displayed as dots. n.s. not significantly different. *p < 0.05; **p < 0.01; ***p < 0.001. All tests are nonparametric Kruskal–Wallis one-way ANOVAs on ranks followed by Dunn’s multiple comparison test.

