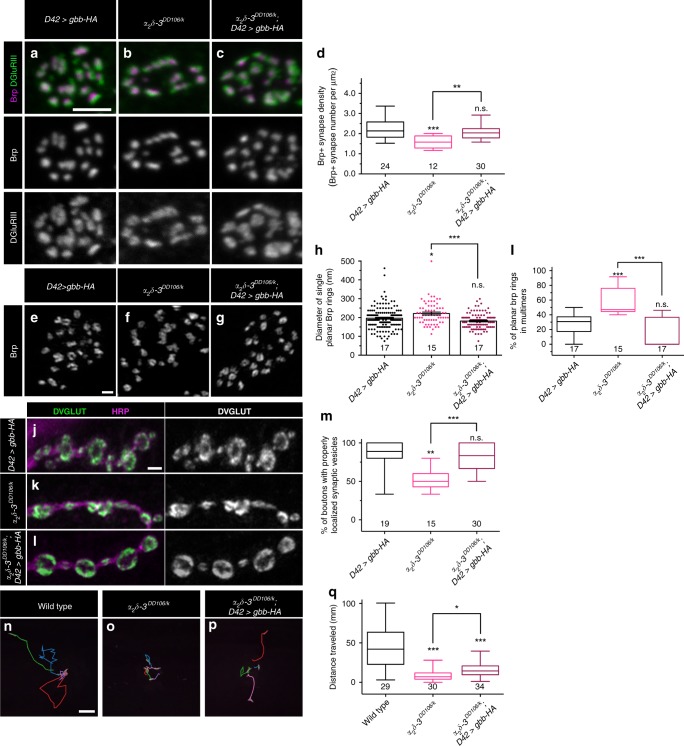
Fig. 8. Overexpressing presynaptic Gbb suppresses α2δ-3 mutant phenotypes.
a–c Representative z-projections of boutons of the indicated genotypes labeled with Brp (magenta) and DGluRIII (green). Scale bar: 2 µm. d Quantification of the Brp + synapse density. n is the number of boutons scored. e–g Representative deconvolved z-projections of boutons of the indicated genotypes labeled with anti-Brp. Scale bar: 1 µm. h Quantification of single planar Brp ring diameters. (i) Quantification of the percentage of planar Brp rings in multimers in boutons. For Brp ring analyses, n is the number of boutons scored. j–l Representative z-projections of boutons of the indicated genotypes labeled with DVGLUT (green) and HRP (magenta). Scale bar: 2 µm. m Quantification of the percentage of boutons exhibiting properly localized synaptic vesicles. n is the number of NMJs scored. n–p Representative traces of third-instar larvae of the indicated genotypes crawling for 3 min. Each color represents an individual larva. Scale bar: 10 mm. q Quantification of the total distance traveled by larvae of the indicated genotypes. n is the number of larvae scored. For the bar graph, error bars are mean ± SEM. For all box-and-whisker plots, error bars are min and max data points, and the center line indicates the median. Individual data points are displayed as dots. n.s., not significantly different. *p < 0.05; **p < 0.01; ***p < 0.001. All tests are nonparametric Kruskal-Wallis one-way ANOVAs on ranks followed by Dunn’s multiple comparison test.

