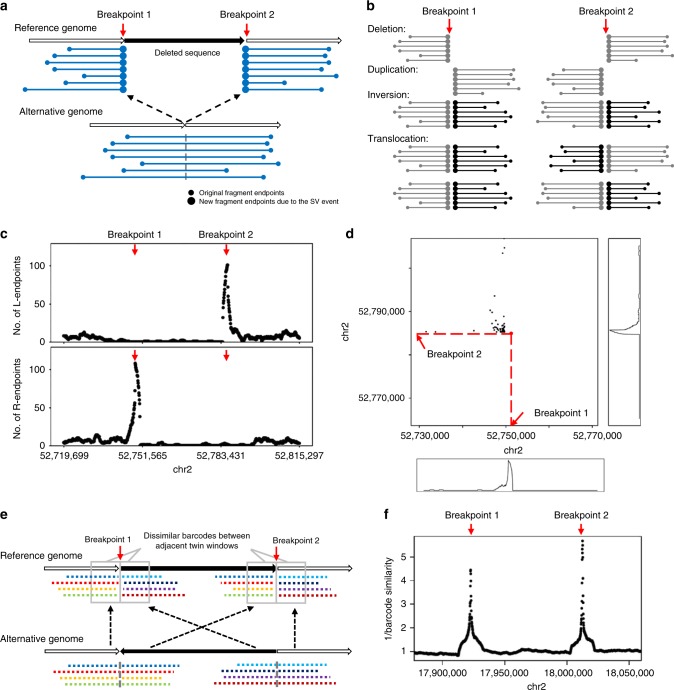
Fig. 1. Two types of evidence near SV breakpoints.
a Type 1 evidence. Reads from HMW DNA molecules that span the breakpoints of a deletion are mapped to two genomic locations, resulting in two sets of observed fragments and two sets of newly introduced fragment endpoints (large dots). b The patterns of enriched fragment endpoints indicate the SV types. Please refer to Supplementary Figs. 1–3 and Supplementary Movie 1 for detailed explanations of how the patterns are formed. c Enriched fragment endpoints detected near two breakpoints of a deletion on NA12878 genome. L-endpoints and R-endpoints are plotted separately. The breakpoint positions are marked by red arrows. d Two-dimensional view of enriched endpoints near the two breakpoints of the deletion. Each dot indicates a pair of fragments which share the same barcode and thus may support the SV. The x-value of the dot is the position of the first fragment’s R-endpoint and the y-value of the dot is the position of the second fragment’s L-endpoint. The background of the 2D plot is cleaner than the 1D plot (panel c) since the fragments that do not share barcodes are excluded. e Type 2 evidence. Reads from two breakpoints of an inversion being mapped to nearby positions (in the gray rectangles), resulting in decreased barcode similarity between the two nearby positions. f Decreased barcode similarity near the breakpoints of an inversion on NA12878 genome. The reciprocal of barcode similarity is shown in the figure. The peaks indicate the positions of the breakpoint.

