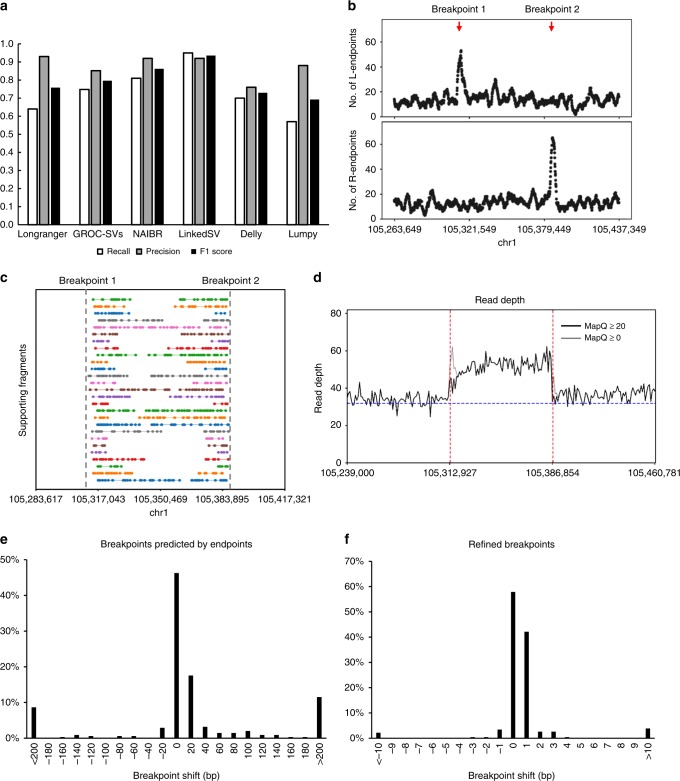
Fig. 2. Performance of LinkedSV on the simulated WGS data set.
a Recalls, precisions and F1 scores of six SV callers on the simulated WGS data set. b Fragment endpoint signals of a small duplication that was missed by GROC-SVs. The peaks indicate the approximate breakpoint positions. c Supporting fragments of the tandem duplication. These are fragments span the junction of the first copy and the second copy. Please refer to Supplementary Fig. 1 and Supplementary Movie 1 for detailed explanations of how the patterns are formed. Horizontal lines represent linked reads with the same barcode; dots represent reads; colors indicate barcodes; dashed vertical gray lines represent breakpoint positions. d Read depth distribution near the duplication region. The black lines showed the depth of reads with mapping quality ≥ 20, while the gray lines showed the depth of reads with mapping quality ≥ 0 (i.e., all reads). Red lines indicate breakpoints predicted by LinkedSV and the blue line indicate the average depth of the whole genome. e Precision of breakpoints predicted by LinkedSV without checking short-read information. f Precision of LinkedSV refined breakpoints using discordant read-pairs and split-reads. Source data is provided as a Source Data file.

