Fig. 3.
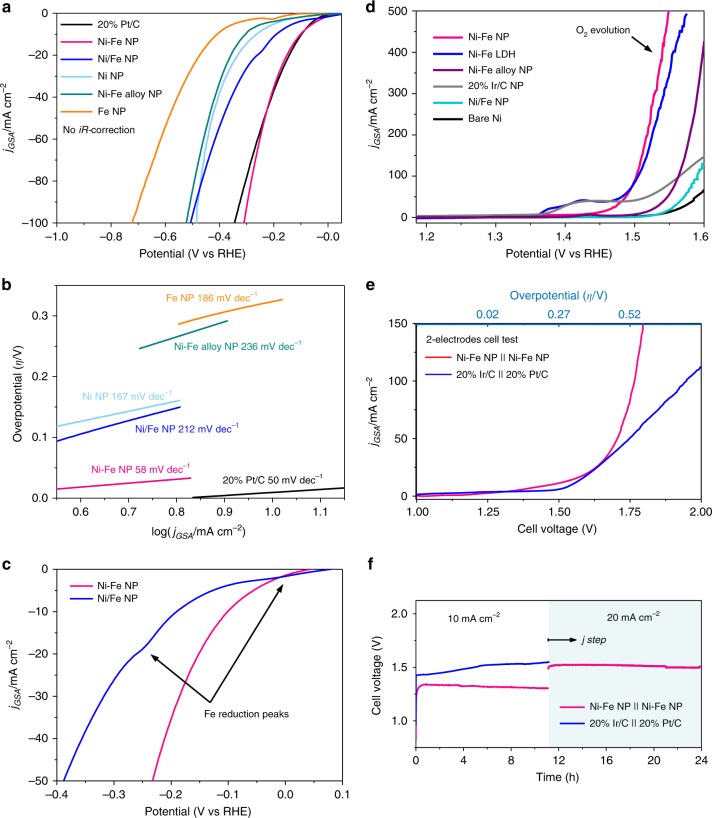
Electrochemistry. a HER-LSV curves for Ni–Fe NP, Ni/Fe NP, Ni NP, Ni–Fe alloy NP, Fe NP, and 20% Pt/C electrode (no iR-correction). b Tafel plots for all nanoparticles and benchmark catalysts. c The LSVs shows the presence of metal reduction peaks from Ni/Fe NP electrode. The peaks at 0 and −0.2 V is identical to Fe3+/2+ and Fe2+/1+ reduction peaks on the HER-LSV of Fe NP electrode shown in a and Supplementary Fig. 20. d The OER LSV curves for Ni–Fe NP, Ni–Fe LDH, Ni–Fe alloy NP, Ni/Fe NP, 20% Ir/C, and NF electrode. e LSV comparing the water-splitting performance of Ni–Fe NP cell and Ir/C-Pt/C cell. f The stability test of Ni–Fe NP cell at current of 10 and 20 mA cm−2 (magenta trace), the blue trace represent the stability of Ir/C-Pt/C cell. All voltammetry was collected in 1 M KOH, with a scan rate of 5 mV s−1.

