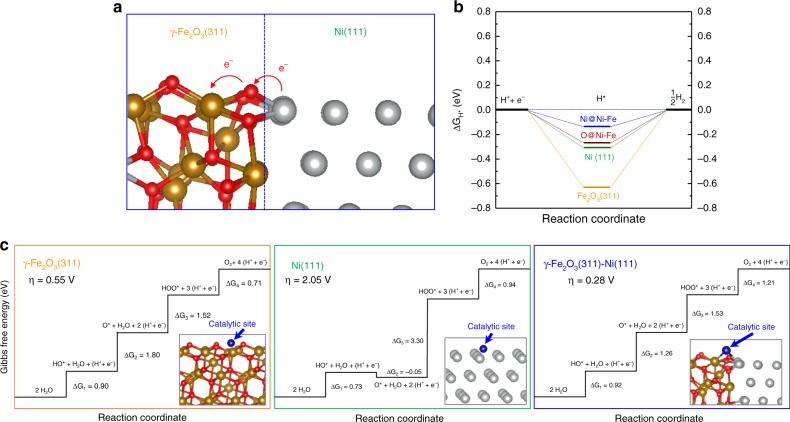
Fig. 4.
Theoretical understanding. a Optimized interface structure of the Ni–Fe heterojunction. b Standard free energy diagram of the HER process on the γ-Fe2O3 (311) and Ni(111) surfaces and their interface in the Ni–Fe heterojunction. c Standard free energy diagram of the OER process on the γ-Fe2O3 (311) and Ni(111) surfaces and their interface in the Ni–Fe heterojunction. The insets show the optimized structures and the catalytic sites for OERs. Key—brown: iron, red: oxygen, gray: nickel, and blue: catalytic site.

