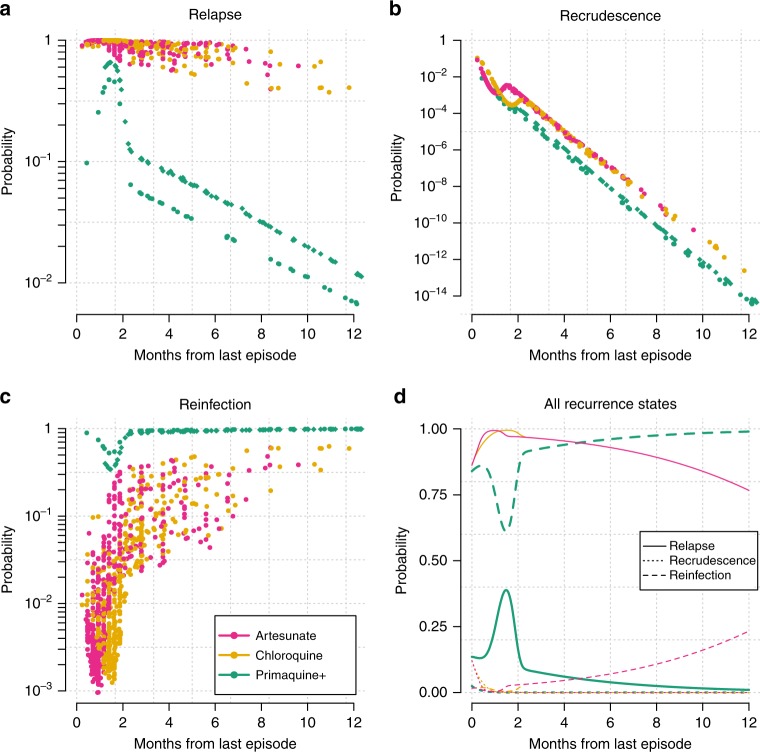
Fig. 1. Dynamics of P. vivax relapse, recrudescence, and reinfection.
Estimates generated under the time-to-event model of the probabilities ( scale) of relapse (a), recrudescence (b), and reinfection (c) for all observed recurrences () are shown as a function of the interval since the last episode of vivax malaria (VHX trial: dots; BPD trial: diamonds). Colours correspond to the treatment used in the previous episode, where Primaquine+ refers to high-dose primaquine with a partner drug (either chloroquine or dihydroartemisinin-piperaquine). For each treatment (colour), the population mean probabilities (linear scale) for the three recurrence states (solid, dotted and dashed lines) are shown as a function of time-to-recurrence (d).

