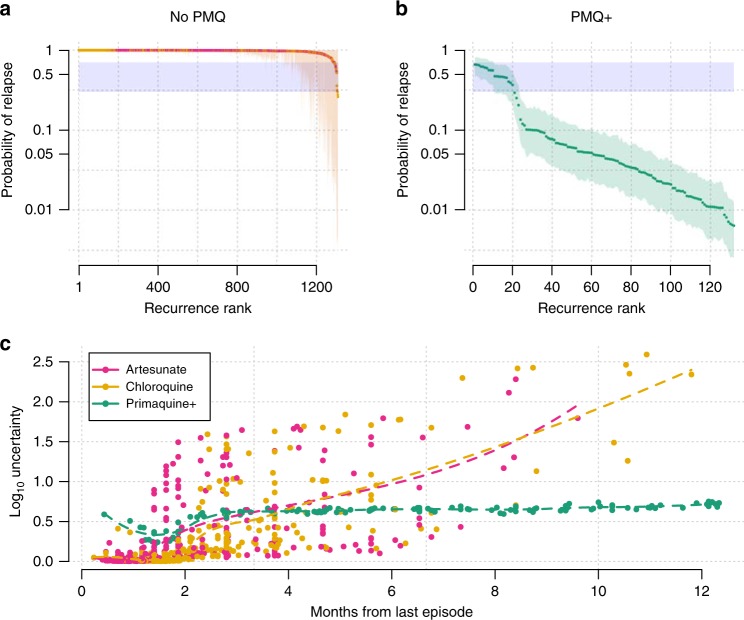
Fig. 2. Probabilities of P. vivax relapse estimated under the time-to-event model.
Top panels: per-recurrence mean probability of relapse together with 95% credible intervals for 1309 recurrences following either artesunate or chloroquine monotherapies (No PMQ, a) and for 130 recurrences following high-dose primaquine with partner drug (PMQ+, b). The recurrences are ranked by their mean probabilities of relapse. The zone of uncertainty (same as in Fig. 3) is highlighted in blue. The upper and lower bounds are arbitrary. c The relationship between time since last episode and the uncertainty of the posterior estimates (width of the 95% credible interval on the scale), coloured by treatment received. The dashed lines represent fitted LOESS curves to highlight trends in the No PMQ and PMQ+ groups, respectively.

