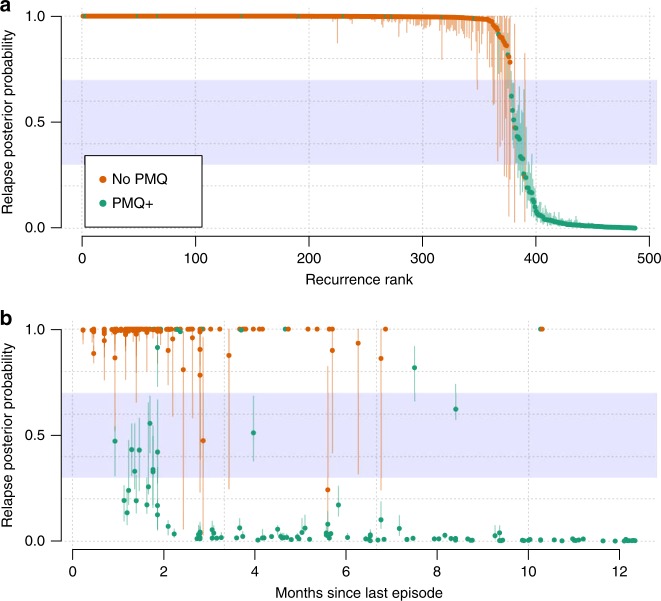
Fig. 3. Probabilities of relapse for 487 genotyped P. vivax recurrences.
a All recurrences ranked by their probabilities of relapse coloured by treatment drug (orange: blood-stage treatment only, No PMQ; green: high-dose primaquine plus partner drug, PMQ+). In all, 95% credible intervals are shown by the vertical lines. b The same posterior probabilities as a function of the time since the last episode of P. vivax with the same colour coding. The uncertainty zone (same as in Fig. 2, and used to classify recurrences in Fig. 4) is shown by the blue zone (the upper and lower bounds are arbitrary).

