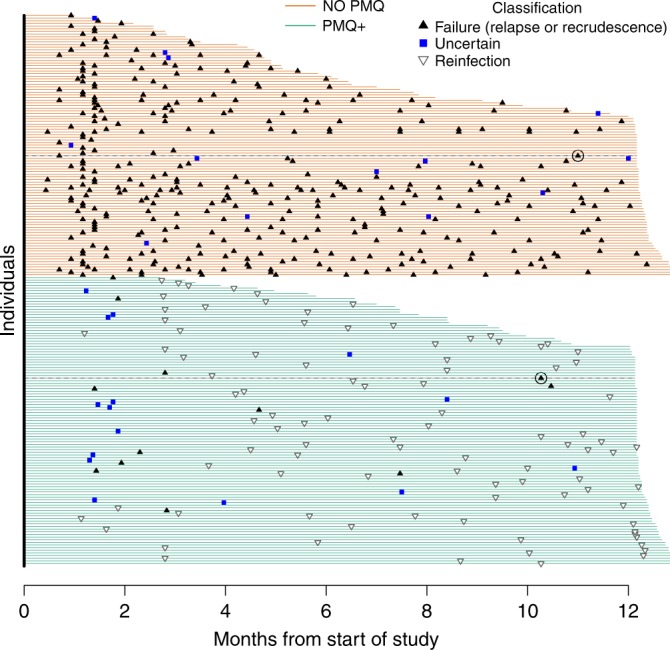
Fig. 4. Classification of 487 genotyped P. vivax recurrences.

Each line represents one individual (). Duration of active follow-up is shown by the span of the horizontal lines (green: high-dose primaquine given, PMQ+; orange: no primaquine given, No PMQ). Recurrences classified as failures are black triangles (point up), reinfections are hollow triangles (point down), recurrences with uncertain classification are blue squares since they fall in the blue zone of uncertainty in Fig. 3. Since there was little evidence of recrudescence, all failures are essentially relapses. The delayed failures (circa ten months after treatment of the previous episode) are circled with their follow-up duration shown by a black dotted line. A histogram summary of these recurrence classifications is shown in Supplementary Fig. 1.
