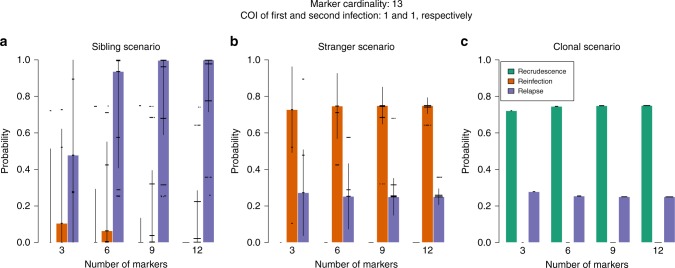
Fig. 5. Probabilities of P. vivax recurrence states with simulated marker count.
Each plot corresponds to a different relationship simulation scenario: a sibling scenario; b stranger scenario; and c clonal scenario. Each coloured bar shows the median of 250 posterior probabilities (dots) with error bars extending two standard deviations. The effective cardinality of each marker was set equal to 13 in these simulations. The complexity of infection was one in both first and second infection. The prior probability of each recurrence state was . As the number of microsatellites genotyped is increased, the following are expected: under the sibling scenario (a), the probabilities should converge to 1 for relapse and 0 otherwise; under the stranger scenario (b), the probability of reinfection should converge to a probability greater than the prior and the complement of that of relapse, meanwhile the probability of recrudescence should converge to 0; under the clonal scenario (c), the probability of recrudescence should converge to a probability greater than the prior and the complement of that of relapse, meanwhile the probability of reinfection should converge to 0.

