Fig. 4.
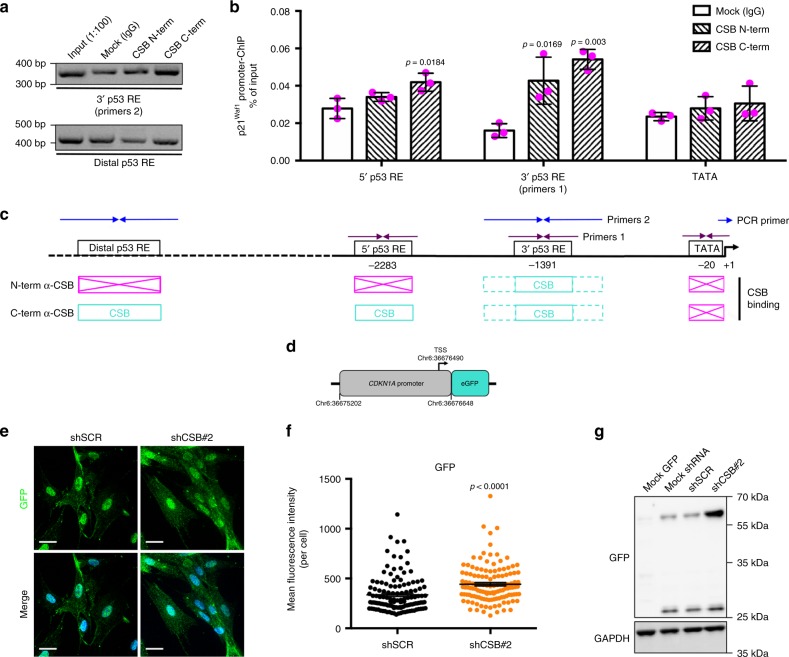
CSB binds to the p21Waf1 promoter. a PCR (agarose gel) and b quantitative PCR (histogram) analyses of several DNA fragments in the p21Waf1 promoter from ChIP assays with either N-term α-CSB [Bethyl] or C-term α-CSB [Abcam] antibodies. c Scheme not at scale of primer positions on the p21Waf1 promoter and summary of positive amplifications in turquoise (boxes in magenta indicate no amplification). n = 3 independent experiments; one-way ANOVA (5’p53RE: F = 7.698, DFn = 2, DFd = 6, p = 0.0220. 3’p53RE: F = 17.11, DFn = 2, DFd = 6, p = 0.0033; TATA: F = 0.8699, DFn = 2, DFd = 6, p = 0.4659) with post-hoc Tukey’s test for each tested regions vs. Mock. d Scheme of the CDKN1A (p21waf1) promoter-eGFP reporter plasmid. e Representative confocal acquisitions of cells stably expressing the CDKN1A (p21waf1) promoter-eGFP reporter upon shCSB#2 silencing or control shSCR, immunostained for GFP (green) to increase the signal of endogenous GFP, and counterstained with Hoechst (blue) after maximum intensity projection with Imaris; scale bar = 50 µM, and f quantification of the GFP mFI/cell; n = 127 cells/condition from three independent experiments, mean ± SEM; unpaired t-test (two-tailed) (t = 4.555, DF = 253), p-value vs. shSCR. g WB of GFP and GAPDH (loading control) in cells not expressing (Mock GFP) or stably expressing (Mock shRNA) the CDKN1A (p21waf1) promoter-eGFP reporter, not silenced (shSCR) or silenced for CSB (shCSB#2). Cells that express GFP display a band at 27 kDa, and also an upper band at around 60 kDa, in particular upon CSB silencing, corresponding to dimers observed in other conditions70. Source data are provided as Source Data files.

