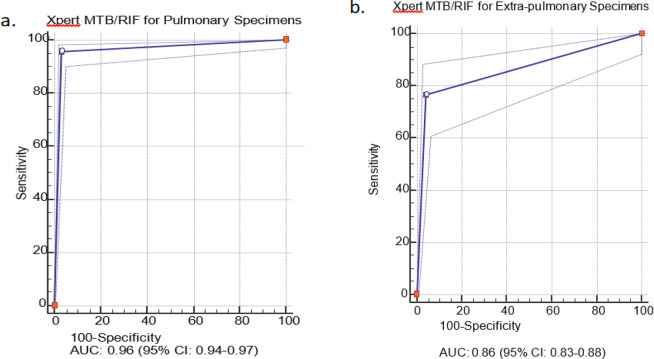
Figure 2.
The summary receiver operating characteristic (SROC) curves for Xpert MTB/RIF assay. The SROC plot shows a summary of test performance, visual assessment of threshold effect, and heterogeneity of data in SROC space between sensitivity and specificity. The dashed blue line that is around the point estimate (blue line) shows 95% confidence region. The area under the curve (AUC), acts as an overall measure for test performance. Particularly, when AUC would be between 0.8 and 1, the accuracy is relatively high. As a matter of fact, AUC was 0.96 for pulmonary specimens in this report which represented a high level of accuracy. If SROC curve was in the upper left corner it would show the best combination of sensitivity and specificity for the diagnostic test. Part “a” and “b” are representative for pulmonary and extra-pulmonary specimens, respectively.

