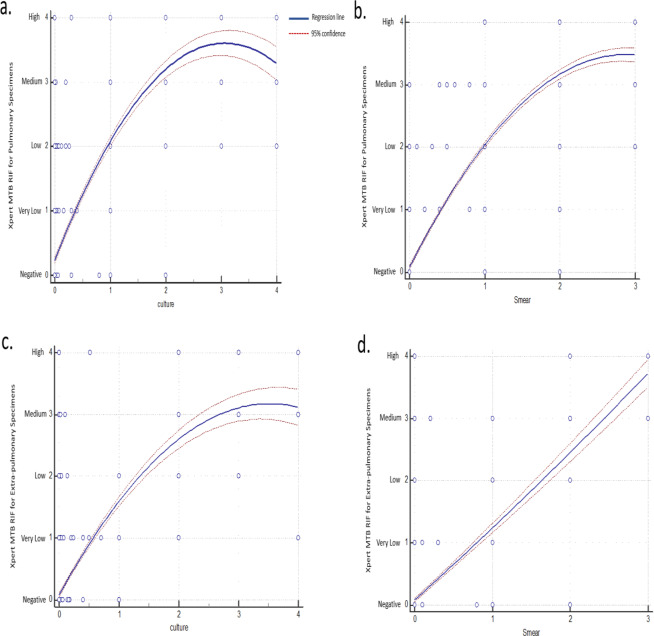
Figure 3.
Quadratic regression plot to compare the Xpert MTB/RIF results with culture and smear microscopy. On Xpert MTB/RIF axis, results are categorized as 0, 1, 2, 3 and 4 which are indicated as negative, very low, low, medium and high scales, respectively. On the smear axis, results are categorized as 0, 1, 2 and 3 which are indicated as negative, 1+, 2+ and 3+ grading, respectively. On culture axis, results are categorized as 0, 1, 2, 3 and 4 which are indicated as negative, 1+, 2+, 3+ and 4+ grading, respectively. Part “a” and “b” are representative for pulmonary specimens and part “c” and “d” are representative for extra-pulmonary specimens. Regression lines showed the correlations between Xpert MTB/RIF results and culture/direct smear methods results.

