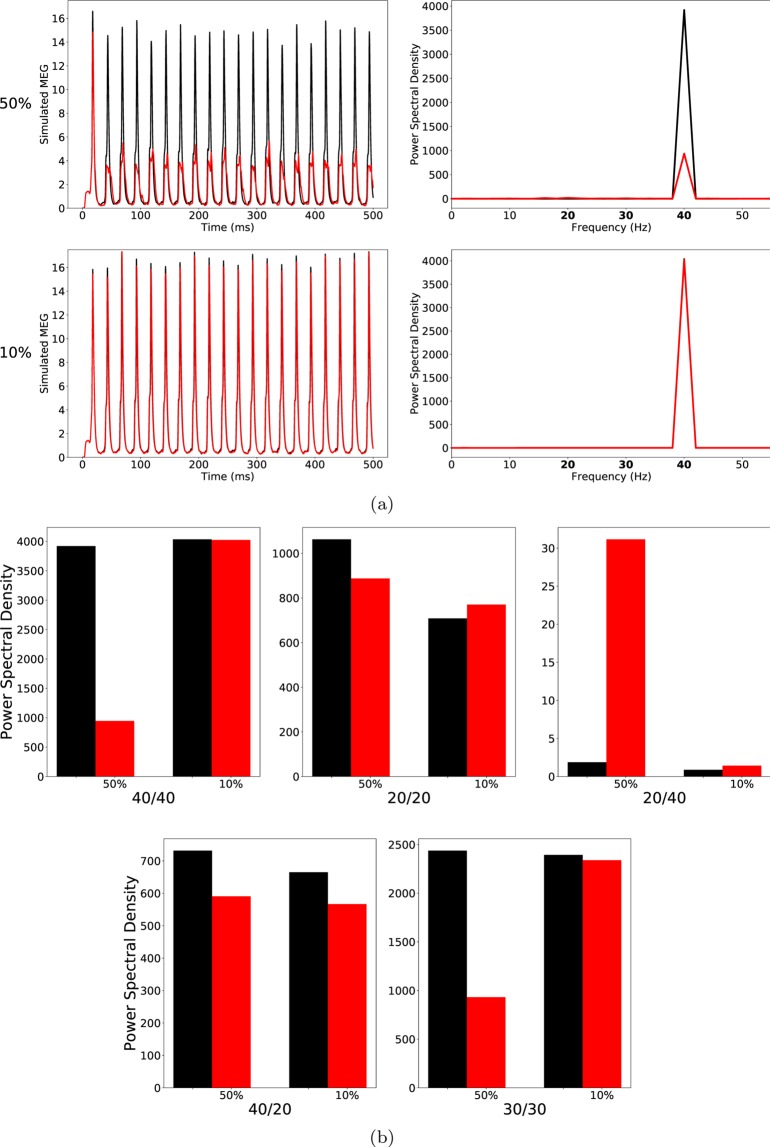
Figure 1.
(a) Left row: Raw simulated MEG signals for high (50%) and low (10%) percentage of chandelier cells among total inhibitory cells for a drive frequency of 40 Hz and the two network conditions (‘control’: black traces; ‘schizophrenia-like’: red traces). Right row: Power spectral density of the MEG signals of the left row. (b) Comparison of the 5 entrainment measures between control (black) and ‘schizophrenia-like’ (red) for high and low ChC percentages. Note that ‘schizophrenia-like’ here means that IPSC decay times at chandelier cell synapses were increased from 8 ms to 28 ms. All traces here depict the mean signal averaged over 20 trials with different realisations of the Poisson process underlying the generation of noise. Importantly, averaging was performed in the time domain prior to a transformation into the frequency domain via Fourier transform, which is also the standard procedure in experiments.

