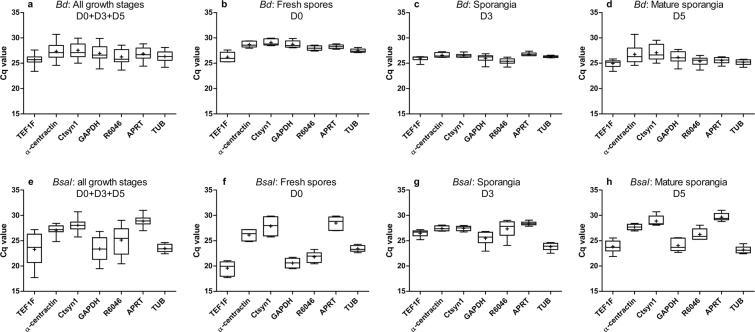
Figure 1.
Cq values of 7 reference genes in Bd and Bsal. Shown is the variation in the mRNA expression (Cq) of TEF1F, α-centractin, Ctsyn1, GAPDH, R6046, APRT and TUB in (a–d) Bd and (e–h) Bsal at different growth stages with (a,e) a combination of all growth stages (D0 + D3 + D5) (n = 18), (b,f) fresh spores at day 0 (D0) (n = 6), (c,g) sporangia at day 3 (D3) (n = 6) and (d,h) a mature culture at day 5 (D5) (n = 6). The whiskers represent the median, the minimum and maximum values, and the first and third quartiles. A plus (+) indicates the mean cq value.

