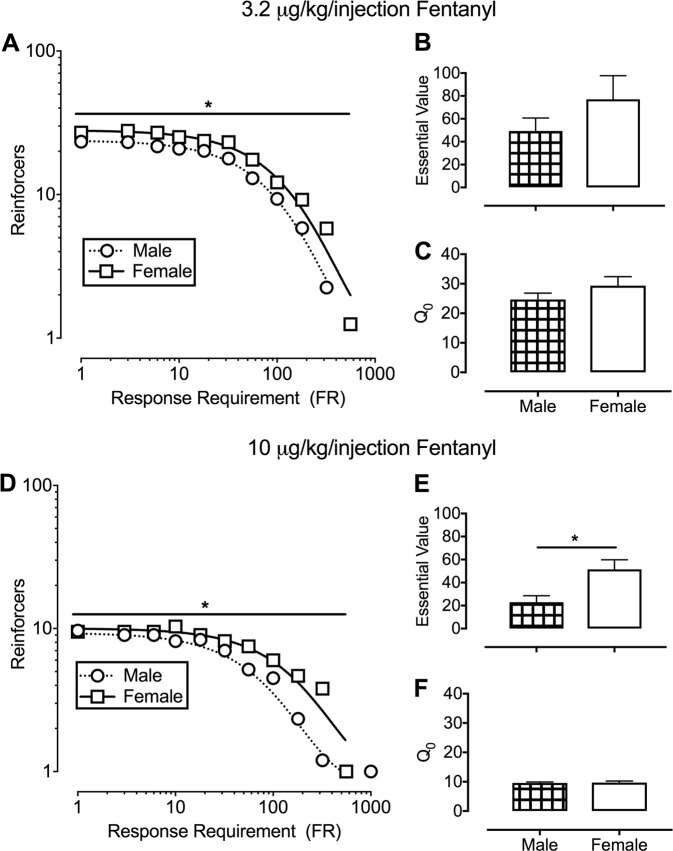
Fig. 3.
Fentanyl-maintained responding under a multi-day progressive-ratio schedule for 3.2 (top panel) or 10 (bottom panel) µg/kg per injection fentanyl in male (circles; n = 6) and female (squares; n = 6) rats. a, d depict aggregate demand functions and nonlinear regression using the exponential model of demand for 3.2 or 10 µg/kg per injection fentanyl, respectively. Ordinate: number of reinforcers earned per 120-min behavioral session. Abscissa: response requirement. Individually determined essential values for 3.2 or 10 µg/kg per injection fentanyl are depicted in b and e, respectively. Individually determined Q0 values for 3.2 or 10 µg/kg per injection fentanyl are depicted in c and f, respectively. *denotes significant (p < 0.05) difference between male and female rats

