
Figure 1.
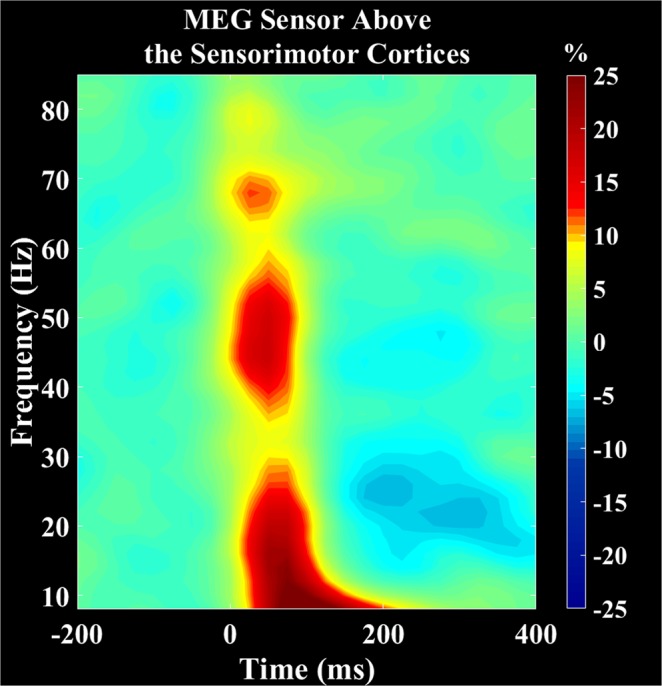
Grand averaged time-frequency spectrograms collapsed across group and conditions. Frequency (Hz) is shown on the y-axis and time (s) is denoted on the x-axis, with 0 ms defined as stimulation onset. The event-related spectral changes after the stimulation are expressed as percent difference from baseline (−200 to 0 ms). The MEG gradiometer with the greatest response amplitude was located near the medial sensorimotor cortices, contralateral to the ankle used during the task. There was a strong event related synchronization (ERS) in the alpha-beta (8–30 Hz, 0 to 125 ms) and gamma (38–80 Hz, 0 to 100 ms) bands for both the passive and active conditions. Additionally, there was an event related desynchronization (ERD) in the beta (18–26 Hz, 300 to 400 ms). The color scale bar is shown on the right.