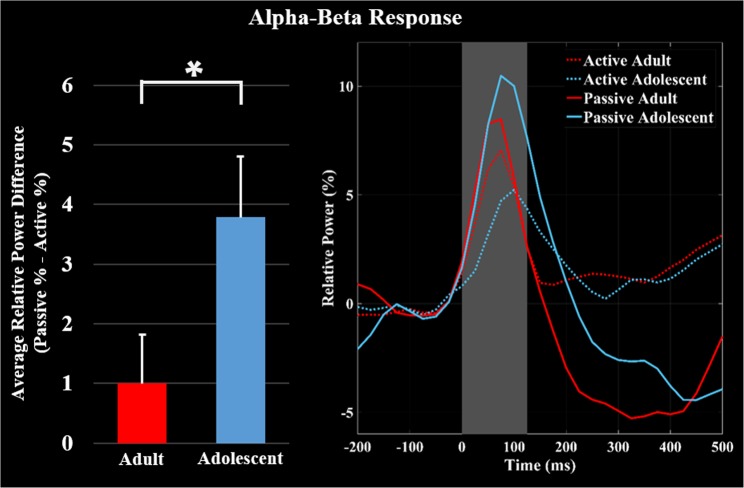
Figure 3.
Average of the neural time courses per condition and group. Time series were extracted from the peak voxel in the alpha-beta grand averaged beamformer images as above, except now they are separated for the adolescents (blue) and adults (red). The solid lines represent the neural time course for the passive condition, while the dashed lines represent the neural time course for the active condition. The bar graph shows the amount of attenuation (Passive – Active) of the average relative power of alpha-beta event related synchronization (ERS) during the 0–125 ms time window. Significant differences in the magnitude of attenuation are denoted by the asterisk (P ≤ 0.05). As shown, the adolescents had greater attenuation (e.g., gating) of the alpha-beta ERS during the isometric ankle plantarflexion task compared to the adults.

