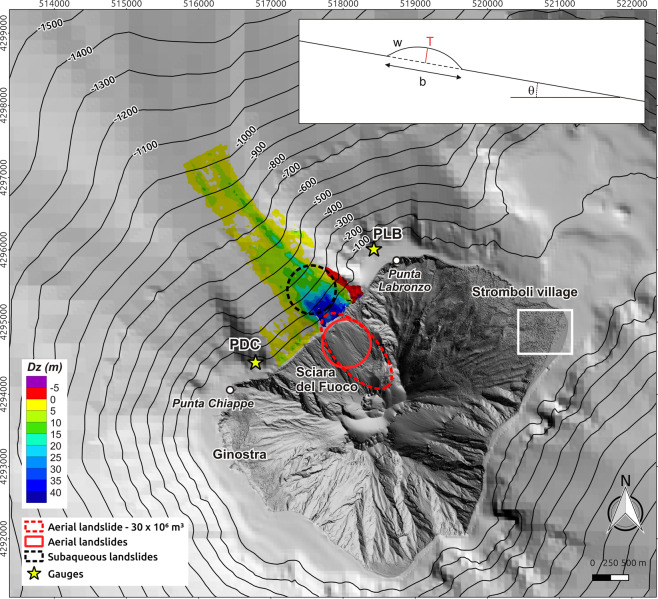
Figure 1.
(a) Hillshading of Stromboli topo-bathymetric grid with the locations and shape of the simulated landslides based on Fig. 9 showed in Chiocci et al.33. PDC (Punta Dei Corvi) and PLB (Punta LaBronzo) are the locations of the monitoring gauges managed by the Laboratory of Experimental Geophysics of the Department of Earth Sciences of the University of Florence (http://lgs.geo.unifi.it/). White square shows the location of trenches described in Rosi et al.4. The inset shows the vertical cross section of the triggering slide (after Ma et al.12). Map was generated using Quantum GIS 2.8.1 software (https://www.qgis.org).

