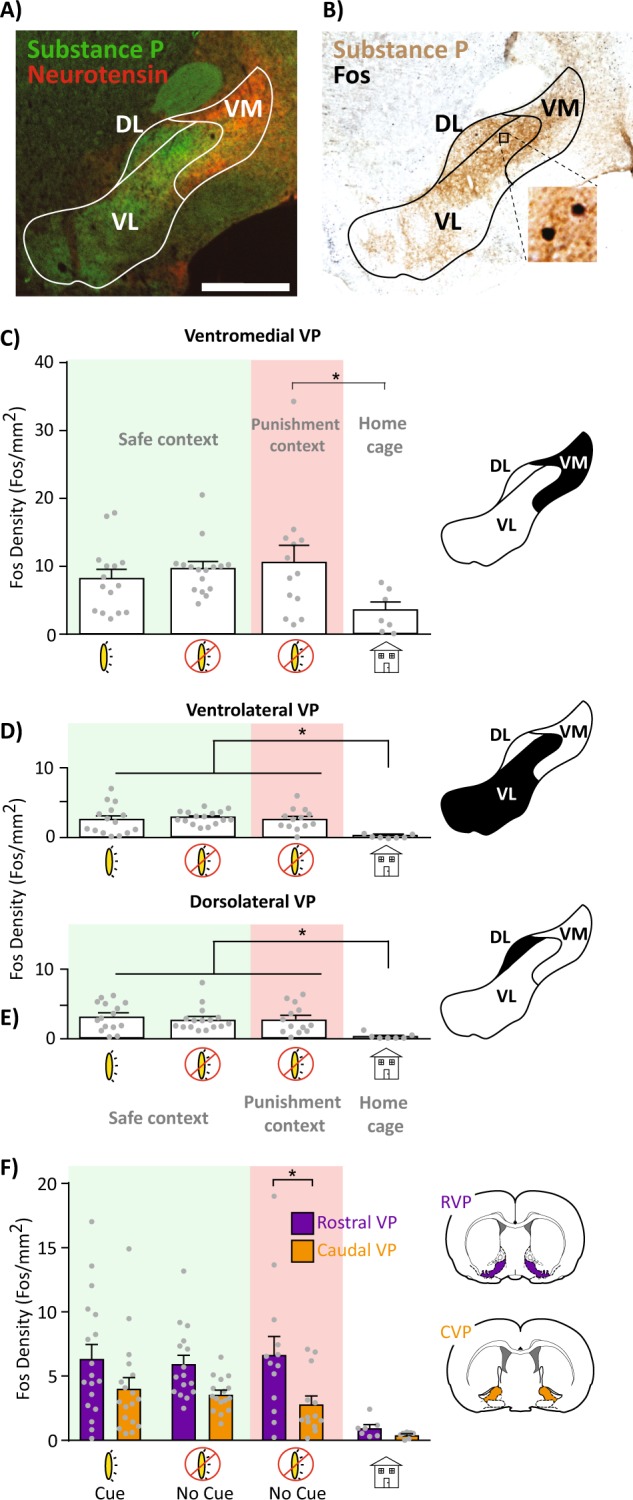
Fig. 5.

VP subregion Fos expression after relapse-like behavior. a Representative image of substance P (VP borders) and neurotensin (ventromedial VP marker) immunofluorescent co-stain. b Representative image of substance P and Fos co-staining used for Fos quantification. c–e Comparison of VP ventromedial (c), ventrolateral (d), and dorsolateral (e) Fos density across reinstatement conditions. Light/green shading = safe context, dark/red shading = punishment context, no shading = home cage controls. f Fos density across the VP rostrocaudal axis after reinstatement tests (collapsed across mediolateral subdivisions). Rostral VP (purple/dark bars) had greater Fos density than caudal VP (orange/light bars) only in the punishment context+no cues condition; VM ventromedial, VL ventrolateral, DL dorsolateral. AC anterior commissure. Scale bar = 1000 μm. *p < 0.05
